Figure 2.
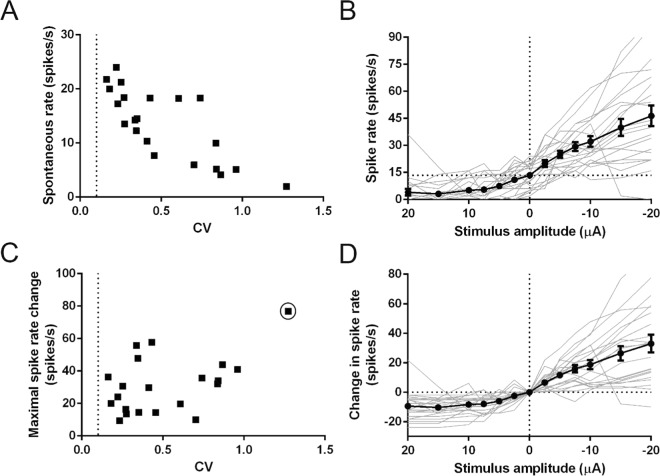
Afferent responses are dependent on iDC stimulation amplitude. (A) CV and spontaneous rate distribution of the analyzed population. There was an inverse correlation between CV and spontaneous rate (Pearson’s; r = −0.7850; p < 0.0001; n = 21 recordings). (B) Individual (grey) and population (black) spike rates in response to anodic (+) and cathodic (−) 2 s-long iDC steps. iDC stimulation resulted in a change of the mean spike rate (Friedman; p < 0.0001; n = 21 recordings). Compared to the spontaneous spike rate (at 0 µA stimulus intensity), the anodic current steps reduced the spike rate, whereas cathodic current increased the spike rate. (C) CV and maximal spike rate change distribution of the analyzed recordings. Increased CV correlated to an increased maximal spike rate change (Pearson’s; r = 0.4879; p = 0.0248; n = 21 recordings) but this was not significant if the high CV outlier (circled) was excluded (p = 0.3182; n = 20 recordings). (D) Individual (grey) and population (black) spike rate change in response to anodic (+) and cathodic (−) iDC steps. Change in spike rate also varied significantly with change in amplitude (Friedman; p < 0.0001; n = 21 recordings). Cathodic iDC steps elicited a greater absolute spike rate change on average than anodic iDC steps (Wilcoxon; p < 0.0001; n = 21 recordings). Error bars are ± SEM. Dotted line at CV = 0.1 in (A,C) shows the cutoff between regular and irregular cells21.

