Figure 3.
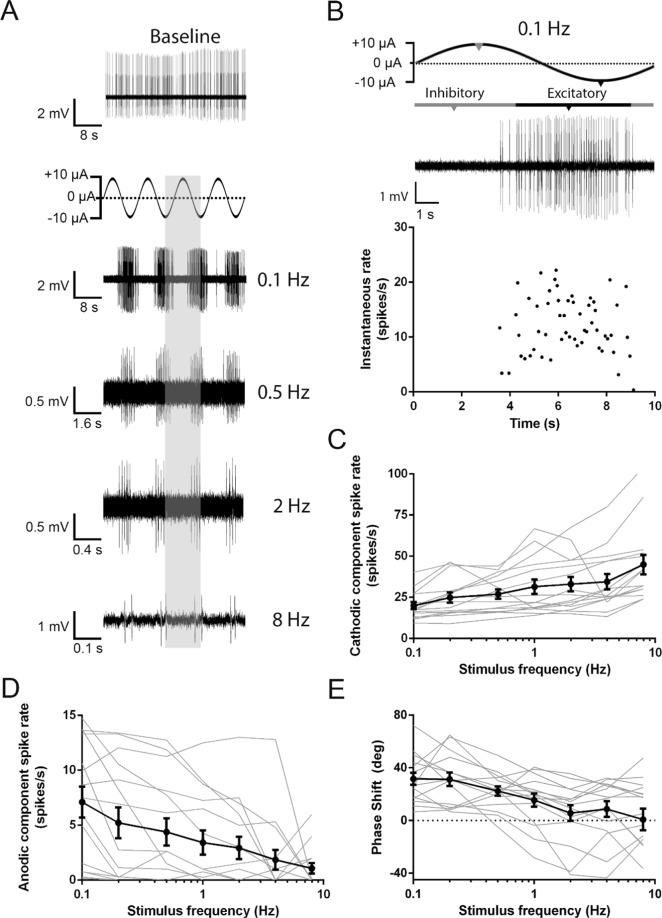
Characterization of firing rate and phase responses to sinusoidal iDC stimuli. (A) Stimulation waveform and representative afferent responses to a ±10 µA sinusoidal current across a range of frequencies. The shaded vertical column indicates the single cycle of the stimulus. The responses are aligned to the single stimulus cycle to observe the phase relationship of the responses to the different stimulation frequencies. (B) Enlarged 0.1 Hz responses from (A) with accompanying diary plot of instantaneous rate, to show the median spike calculation to determine excitatory (black notches)/inhibitory (grey notches) response phase relative to sinusoidal stimulus phase. (C–E) Individual (grey) and average (black) excitatory phase (C) and inhibitory phase (D) spike rate responses across stimulus frequencies. As frequency increased, the excitatory phase spike rate increased (Friedman; p < 0.0001; n = 15 recordings) and the inhibitory phase spike rate decreased (Friedman; p < 0.0001; n = 15 recordings). (E) Individual (grey) and average (black) phase shift of the excitatory spike rate response in relation to the cathodic stimulus waveform across different frequencies. There was a phase lag at low frequencies that decreased as stimulation frequency increased (Friedman; p > 0.0007; n = 15 recordings). Error bars are ± SEM. Representative traces were filtered with a Gaussian bandpass filter (5 Hz −2.5 kHz) to better display the data.

