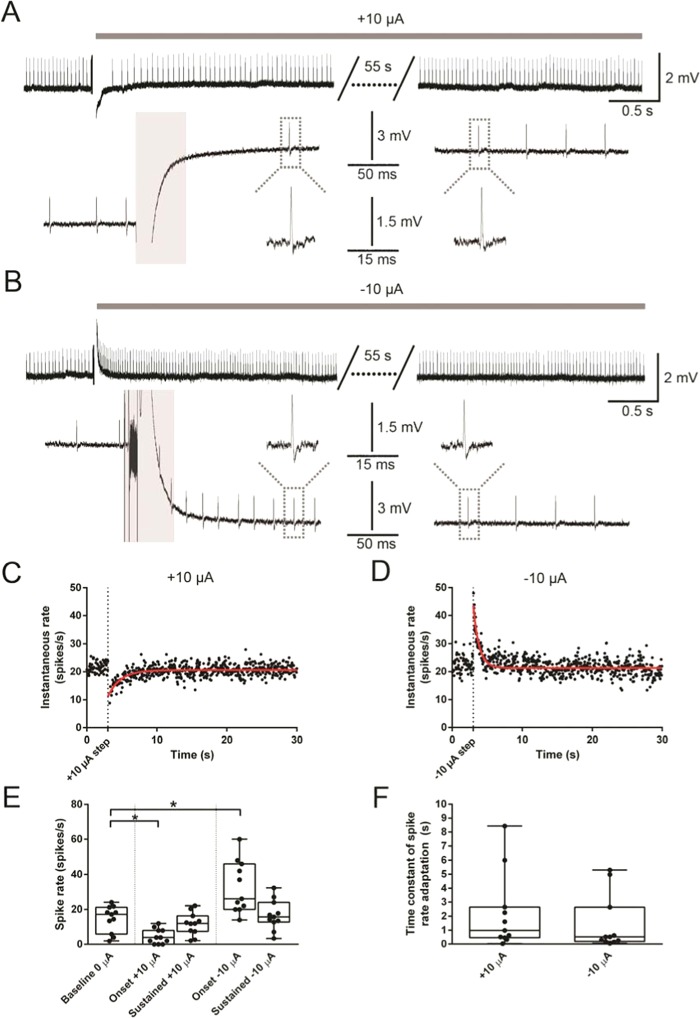
Figure 4.
iDC stimulation induces spike rate adaptation. (A,B) Representative traces showing an afferent response to a +10 µA and −10 µA 60 s long iDC step, at 3 magnifications. The grey bar indicates the 50 ms period during the artifact where analysis was blanked. Dotted lines indicate representative spikes that were further expanded. (C,D) Diary plots of instantaneous spike rate versus time for the recordings shown in (A,B). Each data point reflects 1/inter-event interval. Red lines show one-phase exponential fits used to determine time constants of spike rate adaptation. (E) box and whiskers plot showing the spontaneous rate (60 seconds pre-stimulus), onset spike rate (first 50–550 ms after stimulus onset), and sustained spike rate (10–60 s after stimulus onset) during a 60 s long ±10 µA step. Compared to the baseline spike rate, at onset, anodic and cathodic steps reduced or increased the spike rate, respectively (Friedman; p < 0.0001; Dunn’s multiple comparisons; −10 µA onset: p = 0.28; +10 µA onset: p = 0.0061; n = 11 recordings) but sustained spike rates were not significantly different from baseline (Dunn’s multiple comparisons; −10 µA sustained: p > 0.9999; +10 µA sustained: p > 0.9999; n = 11 recordings). (F) Box and whiskers plots showing the distribution of spike rate adaptation time constants to 1 min ± 10 µA iDC steps. There was no significant difference in the time course of spike rate adaptation between cathodic and anodic steps (Wilcoxon; p = 0.5195; n = 11 recordings). In (A,B) for better display of the long duration data, the traces were filtered with a Bessel (8 poles) 50-Hz high pass filter.

