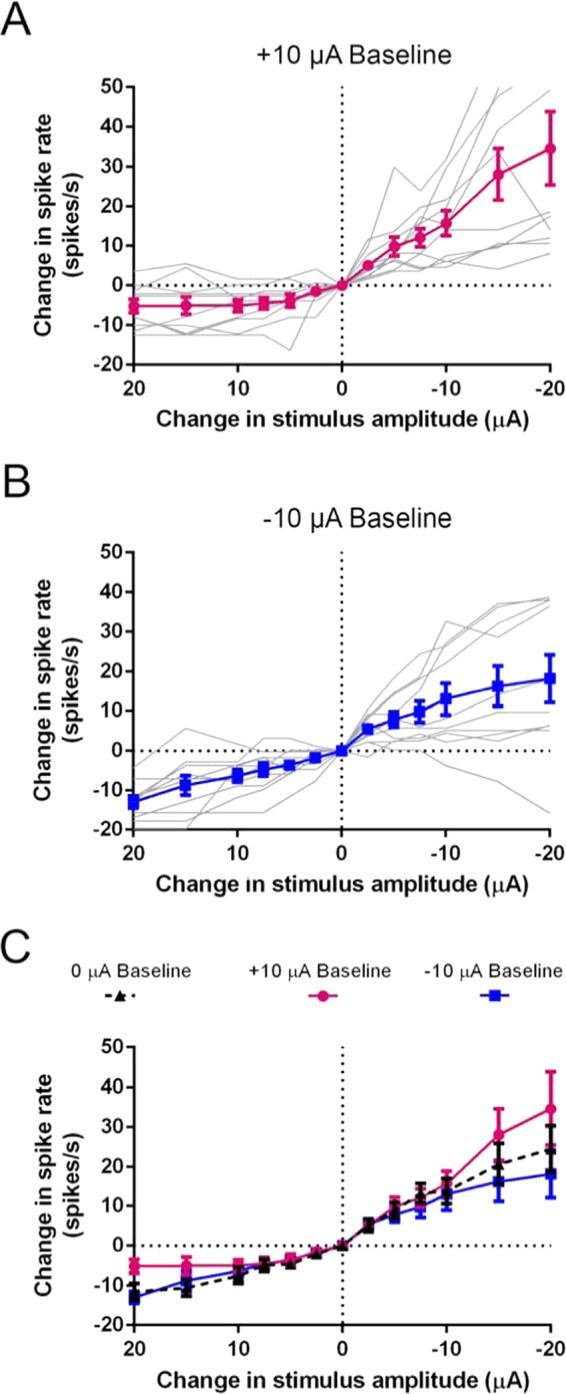
Figure 5.

Changes in iDC-induced spike rate activation after spike rate adaptation. (A,B) Individual (grey) and population (coloured) spike rate change in response to anodic (+) and cathodic (−) 2-s long iDC steps (protocol as in Fig. 2) after adaptation to a constant +10 µA (A) or −10 µA (B) baseline, applied for 60 s before steps. (C) Mean spike rate change in response to anodic (+) and cathodic (−) iDC across different baselines (+10 µA, 0 µA and −10 µA). There was a significant interaction between baseline and step amplitude (2way RM ANOVA; p = 0.0382; n = 10 recordings). At the greatest cathodic intensity (−20 µA), when compared to the 0 µA baseline control, the elicited change in spike rate was larger for the +10 µA baseline (Holm-Sidak multiple comparisons; p = 0.0016) and smaller for the −10 µA baseline (p = 0.0288). At the greatest anodic intensity (+20 µA), the change in spike rate was smaller for the +10 µA baseline (p = 0.0222) but not significantly different for the −10 µA baseline (p = 0.3129). Error bars are ±SEM.
