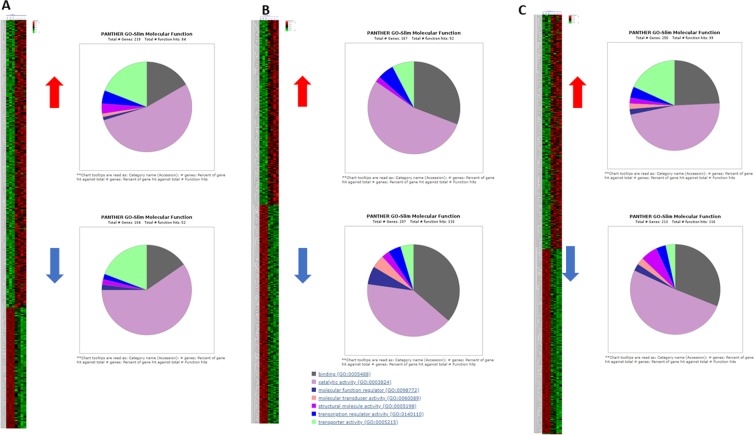
Figure 5.
Unsupervised clustering with k-means and GO for molecular function of differentially expressed genes. (A) Cluster one has 339 genes in total with an homogeneity of 0.313, with 235 genes up and 104 down-regulated compared to control, and gene ontology classification for molecular function. (B) Cluster two has 383 genes in total with an homogeneity of 0.122, with 167 genes up and 207 down-regulated compared to control, and gene ontology classification for molecular function. C. Cluster three has 498 genes in total with an homogeneity of 0.040, with 280 genes up and 218 down-regulated compared to control, and gene ontology classification for molecular function. Sub-clustering considering the analysis of the 1219 differentially expressed genes (absolute expression), where red is 0~2 and green 0~−2, K-Means from Expander was used.

