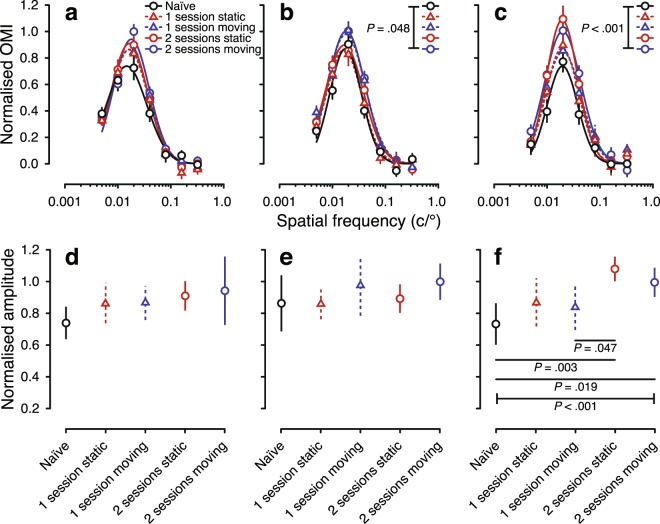
Figure 3.
Spatial-frequency tuning from the optomotor response of visually naïve and experienced larval zebrafish at 7 dpf. The top row shows spatial-frequency tuning functions (mean ± SEM) at stimulus speeds of (a) 25 °/s (b), 50 °/s, and (c) 100 °/s. Black solid, red dashed, blue dashed, red solid and blue solid lines show functions for naïve, 1-session static, 1-session moving, 2-session static and 2-session moving groups, respectively. Tuning functions are a three-parameter log-Gaussian, fit by minimising the least-squares error. The bottom row shows normalised amplitude at stimulus speeds of (d) 25 °/s (e), 50 °/s, and (f) 100 °/s. Error bars show the 95% confidence intervals. P < 0.05 after Bonferroni correction was considered to be statistically significant.

