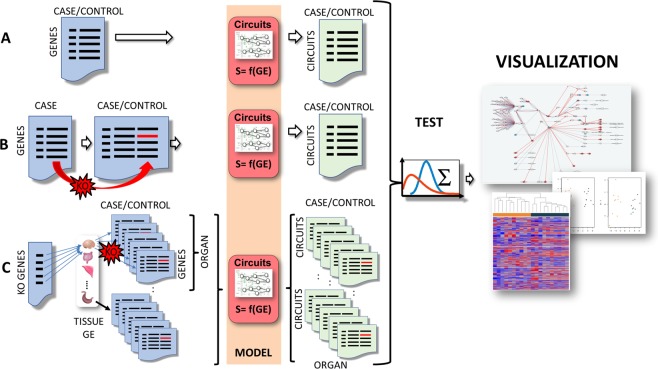
Figure 1.
Schematic representation of the three analysis scenarios implemented in the Hipathia web server. (A) Conventional transcriptomics case/control study transformed by Hipathia into a differential signaling circuit activity contrast. (B) Interactive simulation of the effect of a mutation over the signaling circuits. (C) Estimation of the potential effect of a list of mutations over the different signaling circuits in a number of selected human tissues. Icons for organs were taken from the Reactome Icon Library111

