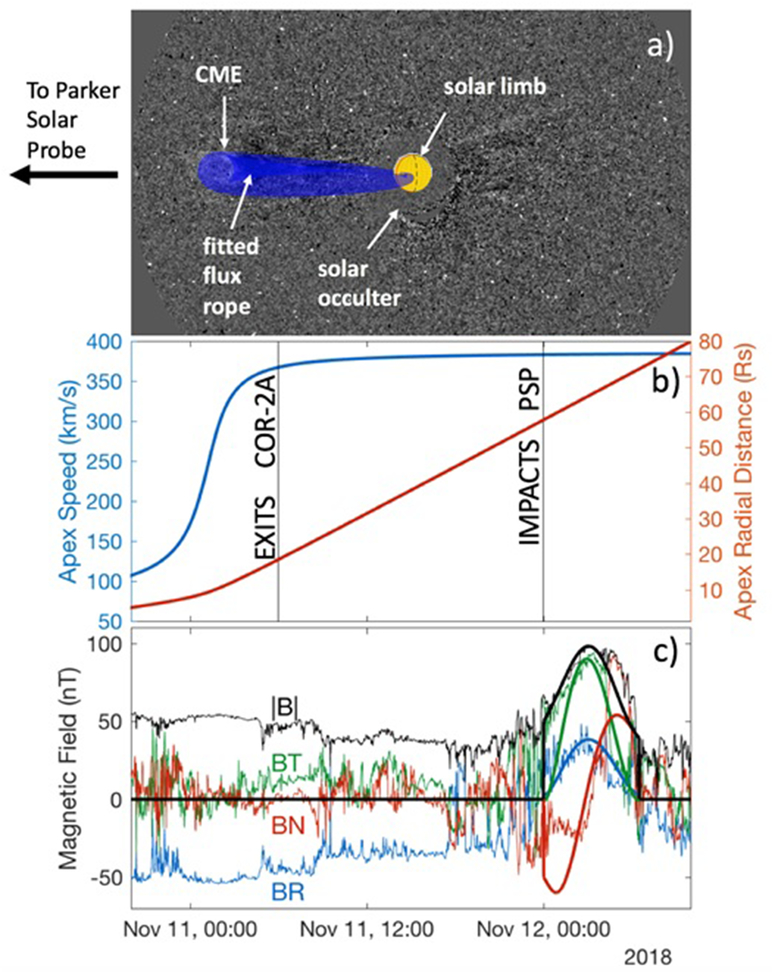
Extended Data Fig. 2:
Coronal Mass Ejection Model and Comparison to Magnetic Field Data
Panel a: the same as Fig. 1b but with superposed fitted-flux rope CME shape at 02:39UT on 11 November 2018 when the CME had passed half way through the COR-2A field of view. The CME is very weak and no shock-sheath structure can be identified in these images. The typical aspect of the CME in the image results from the line of sight integration of plasma distribution on a bent toroid such that its major axis is located in a plane containing the observing spacecraft (see very similar events in Thernisien et al. 200927, Rouillard et al. 200928). Panel b: The position (red line) and speed (blue line) of the apex of the flux rope model was derived by comparing iteratively each synthetic image produced by the 3-D model with each available COR-2A image. A functional form (arctangent) was imposed for the flux rope’s varying speed. The fitted CME structure assumed in the present work is a bent toroid with an exponential increase of its cross-sectional area from footpoint to apex as in Wood et al. (2009)29. Panel b: The speed was derived by fitting a hyperbolic tangent to the modeled CME position. The speed increases rapidly from under 100 km/s at 18UT on 10 November to over 350 km/s when it exited the COR-2A field of view at around 6UT on 11 November. Panel c: An internal magnetic field structure was expressed analytically inside the envelope of the fitted CME (smooth curves) as in Isavnin (2016),30 but keeping here a simple circular cross section of the flux rope. By propagating this flux rope at a constant speed of 380 km/s from the time it exits the COR-2 to Parker Solar Probe, we predict an impact of the CME at PSP on 12 November 2018. The predicted arrival time and the magnetic properties of the CME (thick smooth line) are in good agreement with those measured in situ by the FIELDS (magnetic field data shown; thin lines) and SWEAP instruments. We therefore conclude that the fitting procedure presented here provides a good description of the CME evolution from the upper corona to PSP.

