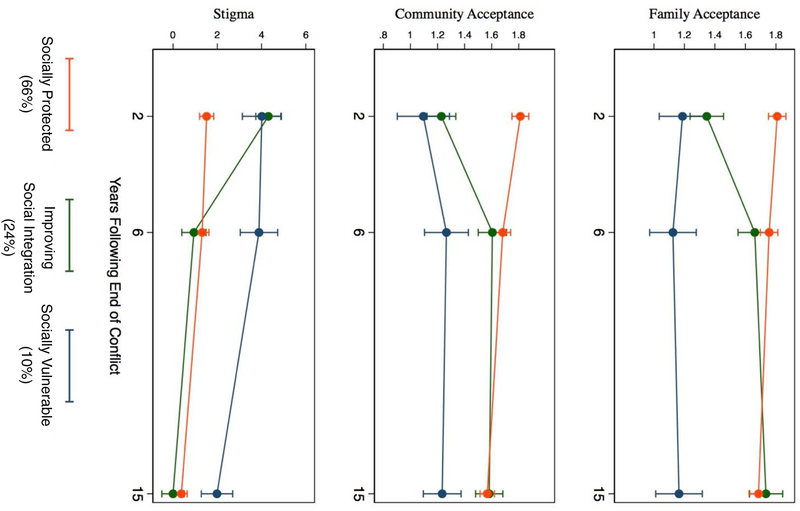
Figure 3. Latent Group Classification of Social Integration Trajectories Estimated by Full Information Maximum Likelihood (N=323).
Note: In figure 3, estimated latent classes of social integration trajectories with 95% confidence intervals are presented by social risk (perceived stigma) and protective (family and community acceptance) factor measures. A three-group solution was optimal, based on the sample-size adjusted BIC, resulting in a “Socially Protected” group (n=213), an “Improving Social Integration” group (n=77), and a “Socially Vulnerable” group (n=33).

