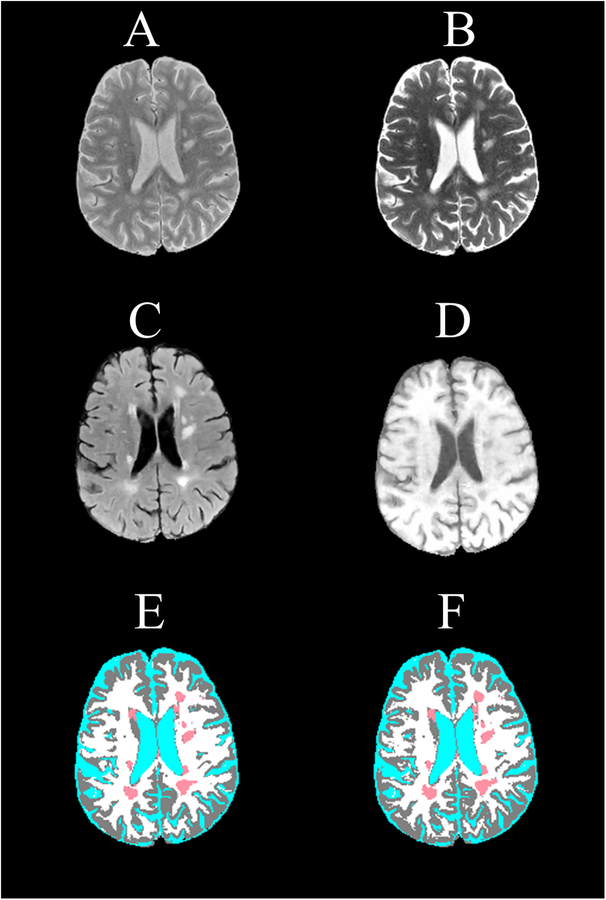
Figure 2.
Brain MRI images of an MS patient used as input to the segmentation CNN showing (A) proton density-weighted, (B) T2-weighted, (C) FLAIR, and (D) T1-weighted, and the corresponding (E) expert-validated MRIAP segmentation and (F) the CNN-generated segmentation. The tissue classes are color coded as white (WM), gray (GM), cyan (CSF), and light red (T2 lesions). DSC values of 0.90 (WM), 0.93 (GM), 0.99 (CSF), and 0.88 (T2 lesions) indicate high correspondence between the expert-validated and CNN-generated segmentations.

