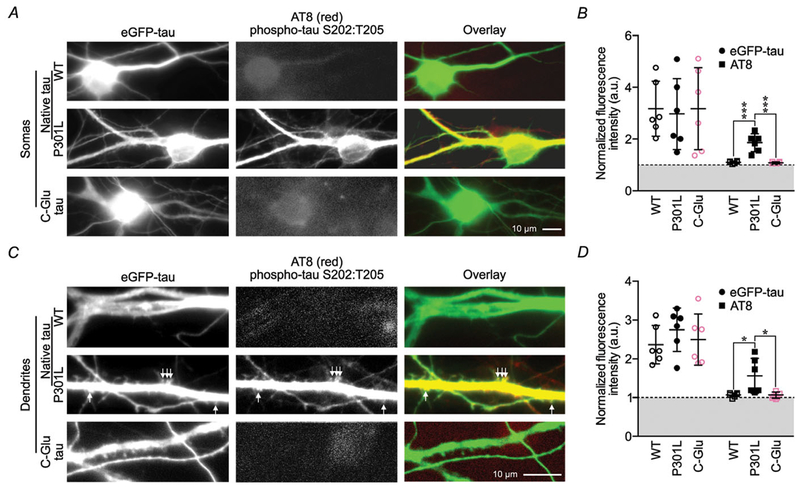
Figure 5. Pseudophosphorylation of C-domain residues is not sufficient to induce phosphorylation of the complete set of B-domain residues.
A, representative photomicrographs of neuronal somas expressing native wild-type or P301L eGFP–tau, and neurons expressing variant C-Glu eGFP–tau stained for S202 and T205 phosphorylation with AT8 antibodies. B, quantification of somatic eGFP and AT8 luminance normalized to background fluorescence. C, representative photomicrographs of dendrites from neurons presented in A. D, quantification of dendritic eGFP and AT8 fluorescence luminance normalized to background fluorescence. All data were analysed by two-way ANOVA shielded Bonferroni post hoc analysis. For B, F(1, 30) = 29.57; P < 0.0001. In D, F(1, 30) = 76.51; wild-type and C-Glu P = 0.017. For all, n = 6 neurons; error bars represent mean ± SD.

