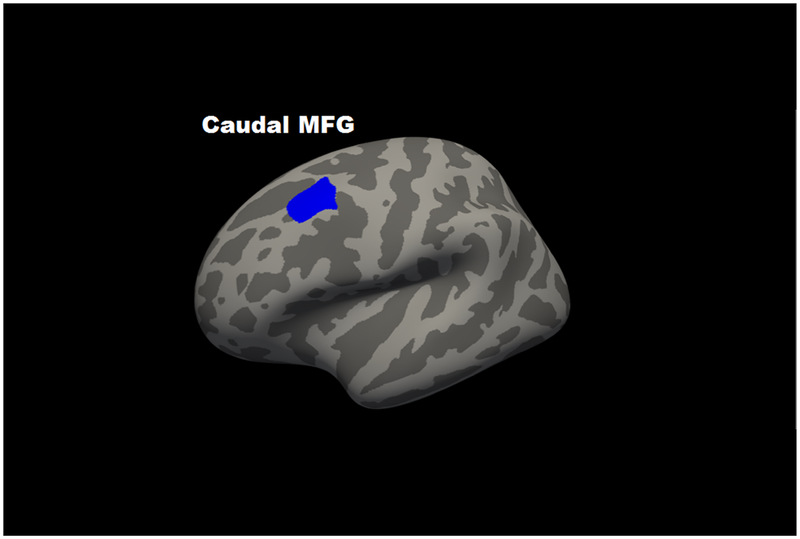
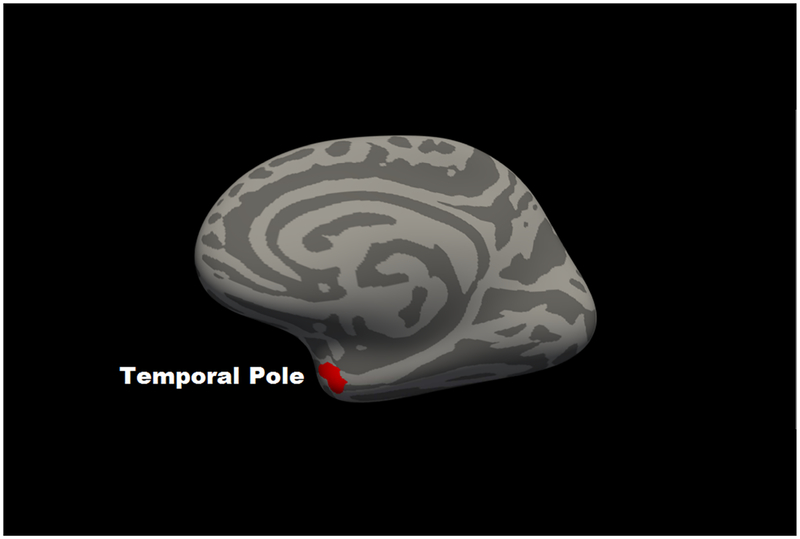
Figure 2. Map of significant voxelwise correlations between cortical thickness and 2-back accuracy at cluster-corrected threshold of p < .05.
Panel A shows left hemisphere lateral view; Panel B shows a right hemisphere medial view. Blue represents regions in which corticial thickness was negatively associated with 2-back accuracy; red represents regions in which cortical thickness was positively associated with 2-back accuracy.


