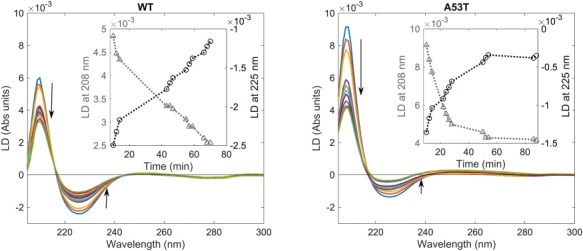
Fig. 2.

Orientation of WT and A53T α-synuclein at the vesicle surface monitored by LD in high viscosity buffer (20 mM phosphate buffer, 1 mM EDTA and 50% wt % sucrose). The spectra were measured over 10 min (arrows indicate time in increasing order). The protein concentration was 30 μM and the L/P ratio was 28. Inset shows the signal at 225 (circles) and 208 nm (triangles) as a function of time.
