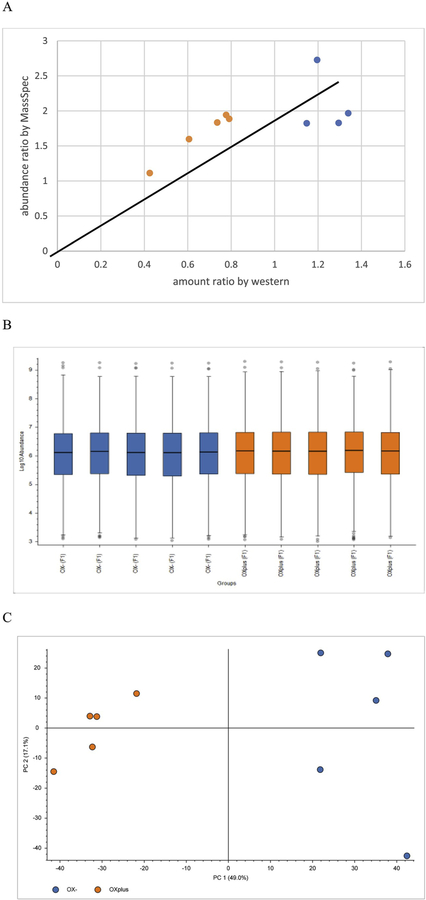
Fig. 4.
(A) Bax level predicted by mass spec and measured by Western blot (blue are samples from oxygen limiting under constant kLa, orange are samples from oxygen sufficient). (B) Distribution of the protein abundance of all samples. (C) Principal component analysis of normalized protein abundances from all ten samples, blue for oxygen limiting under constant kLa, orange for oxygen sufficient.

