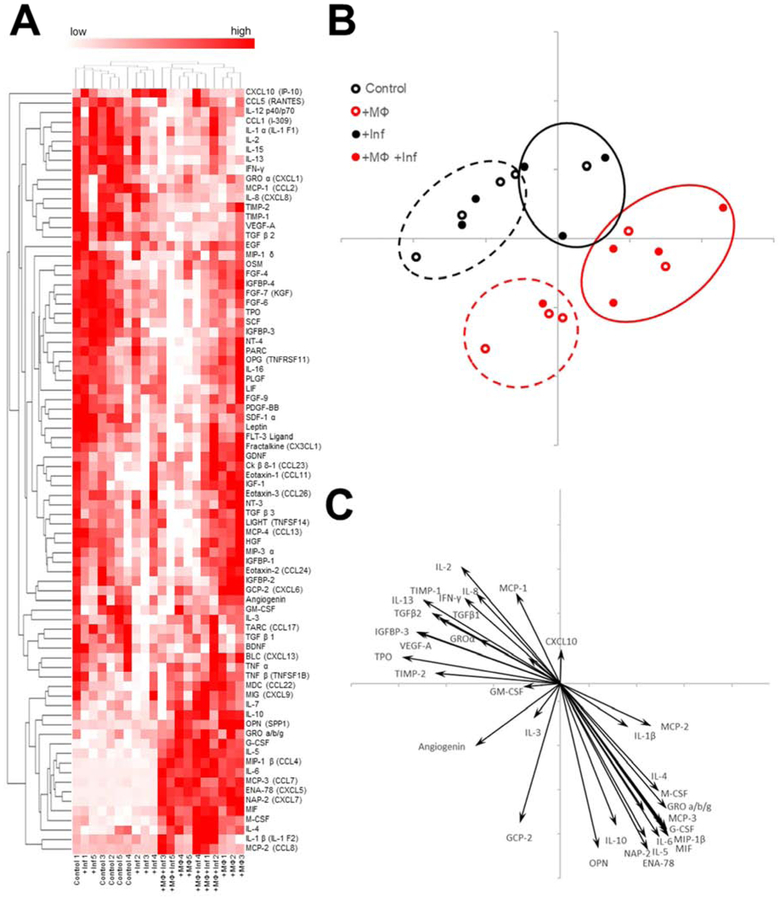
Figure 6. Addition of macrophages and inflammatory cues each contribute to unique cytokine profiles.
(A) 80 cytokines were assayed in the model media at day 3 of differentiation. Cytokine blot intensities were standardized by z-score and reported in a heat Map. Heat scores for each individual sample were represented with red denoting higher relative concentration. (n=5). (B) Principal component analysis was used to interpret the cytokine profiles of each sample. Hierarchical clustering of the cytokine data was used to group each cytokine profile. (C) Biplot of statistically significant cytokine z-scores based on ANOVA shows contributions of cytokines to principal component analysis placements (p<0.05).

