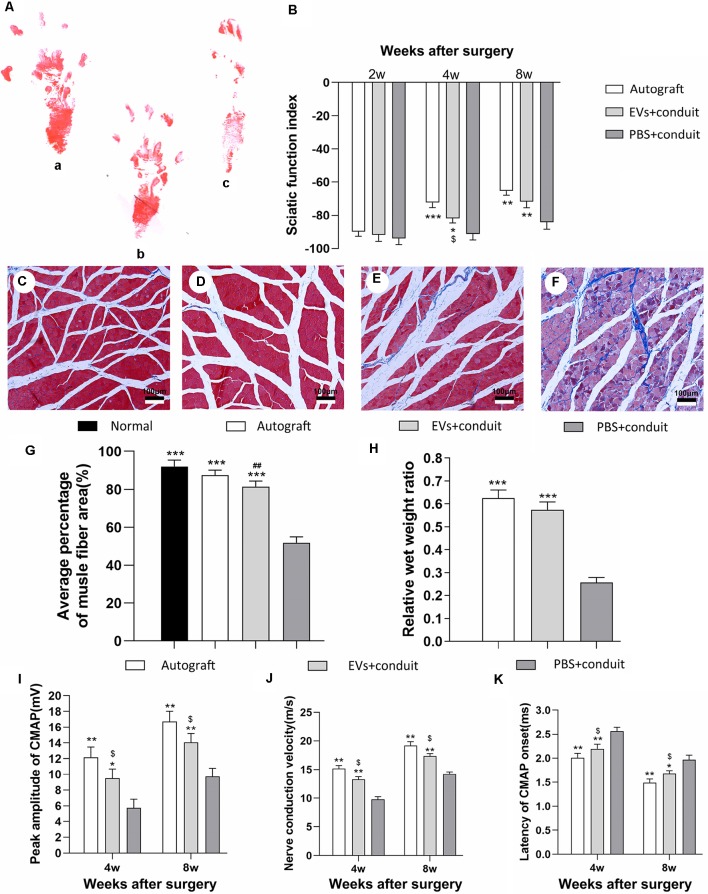
Figure 7.
Functional assessment for regenerated nerves. Notes: representative images of operative left footprints (A) in the autograft group (a), EVs+conduit group (b) and PBS+conduit group (c) at 8 weeks postoperatively. (B) The sciatic function index (SFI) values of each group at 2, 4, and 8 weeks after surgery. Representative light micrographs of gastrocnemius muscles after Masson trichrome staining of the control group (normal muscle; C), the autograft group (D), EVs+conduit group (E) and PBS+conduit group (F). (G) Quantification of average percentage of muscle fiber area in each group. (H) Ratio of injured muscle (ipsilateral) weight to normal muscle (contralateral) weight. The electrophysiological assessment of each group (I–K); the peak amplitude of CMAP (I), the nerve conduction velocity (J) and latency of CMAP onset (K); n = 6 per group, scale bars: (C–F) 100 μm. All data are expressed as the mean ± SEM. One-way analysis of variance (ANOVA) test with Tukey’s post hoc test was used to examine the significance of results. *p < 0.05, **p < 0.01 and ***p < 0.005 for comparison with the PBS+conduit group, $p < 0.05 for comparison with the autograft group and ##p < 0.01 for comparison with the control (normal muscle) group. Abbreviations: EVs, extracellular vesicles; CMAP, compound muscle action potential.

