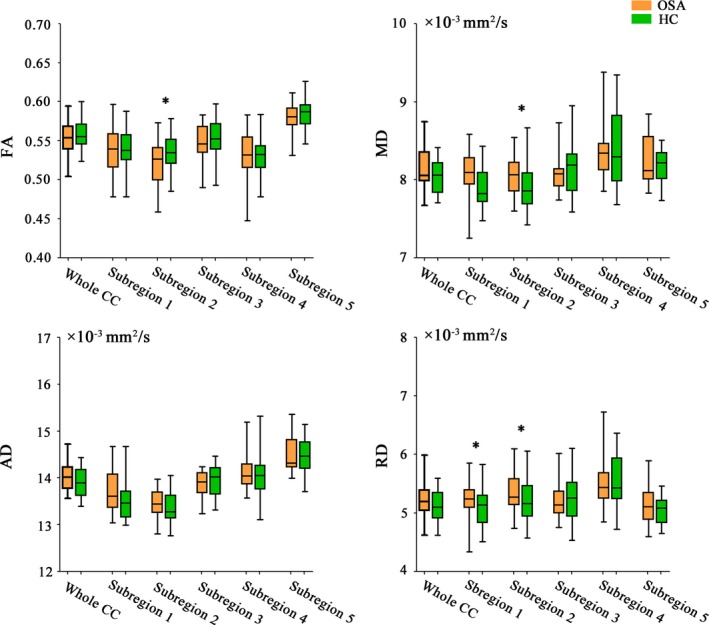
Figure 2.

Alterations in diffusion metrics of the corpus callosum subregions. The horizontal line in the middle of each box indicates the median, while the top and bottom borders mark the 75th and 25th percentiles, respectively. The whiskers above and below the box mark the maximum and minimum values. Abbreviations: AD, axial diffusivity; CC, corpus callosum; FA, fractional anisotropy; HC, healthy controls; MD, mean diffusivity; OSA, obstructive sleep apnea; RD, radial diffusivity
