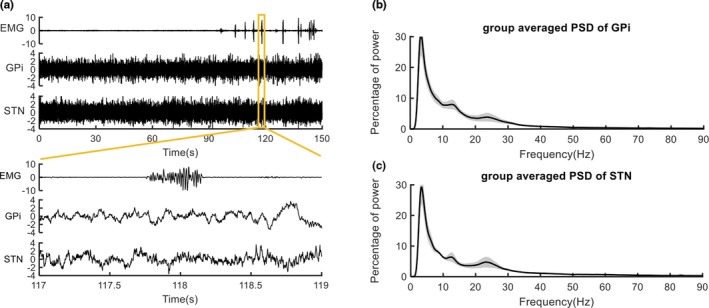
Figure 1.

Signals and the power spectral density. The electromyography (EMGs) recorded from the symptom‐involved muscle and local field potentials (LFPs) recorded from ipsilateral globus pallidus interna (GPi) and subthalamic nucleus (STN) in case 2 are shown, respectively, in the time range of 0–150 and 117–119 s in panel (a). The percentage power spectra over 0–90 Hz of LFPs recorded at resting state and averaged across all cases are shown in panels (b and c). The alpha power peaks and high beta power peaks were found in both GPi and STN
