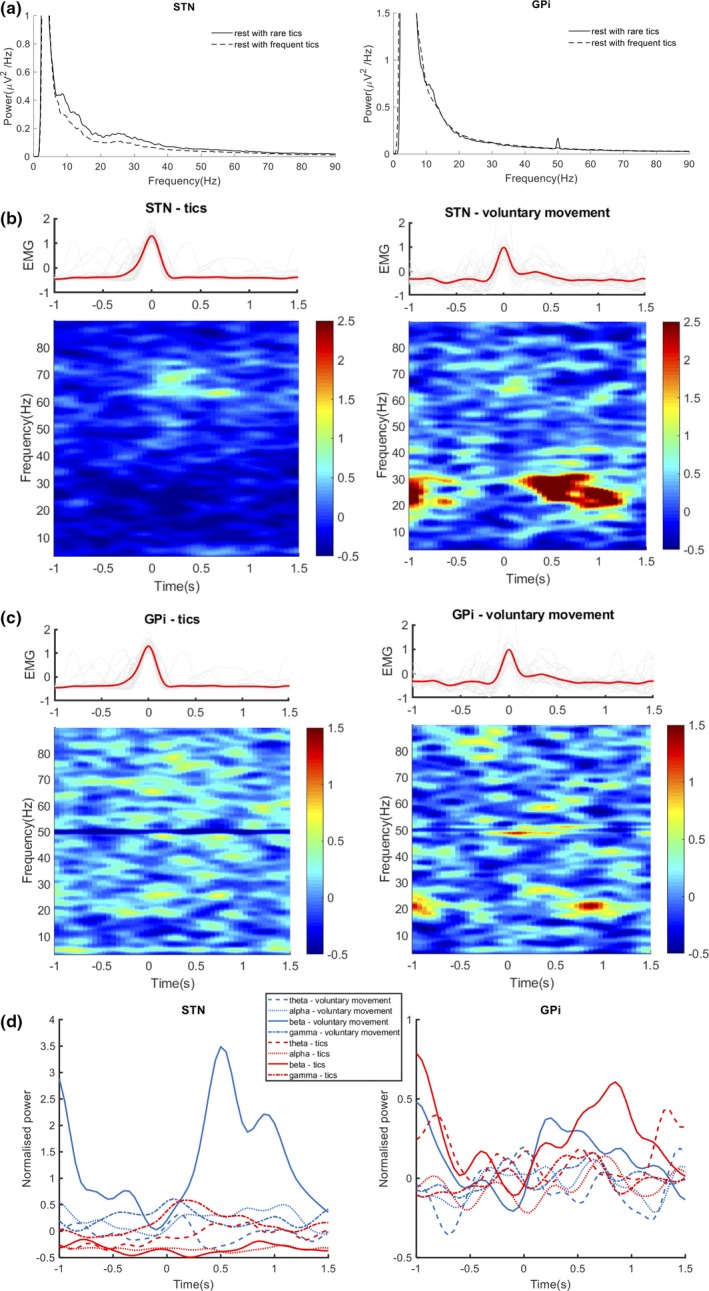
Figure 3.

Oscillations modulated by tics and voluntary movement. (a) Power spectra of the local field potential signals in the subthalamic nucleus (STN) and the globus pallidus interna (GPi) at resting state with rare and frequent tics. (b) Trial‐averaged spectrogram of the tics and voluntary movement‐modulated oscillations in the STN and the electromyography (EMG) signals aligned at the time of maximum muscle contraction. (c) Trial‐averaged spectrogram of the tics and voluntary movement‐modulated oscillations in the GPi and the EMG signals aligned at the time of maximum muscle contraction. (d) time‐varying power dynamics of the movement‐modulated oscillations over theta (4–8 Hz), alpha (8–15 Hz), beta (15–30 Hz), and gamma (60–75 Hz) bands. The movement event‐related desynchronization (ERD) and postmovement event‐related synchronization (ERS) over beta band were seen in both nuclei during voluntary movement. The movement ERS over gamma band was seen in the STN during voluntary movement and tics
