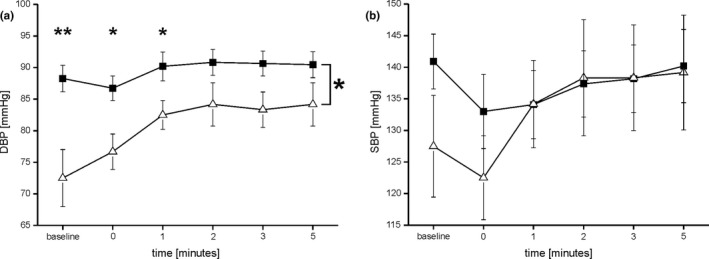
Figure 3.

Depicts the diastolic blood pressure (DBP) (a) and the systolic blood pressure (SBP) over time (b) in mmHg during the orthostatic hypotension test. DBP is higher in PD patients (filled squares) compared to healthy controls (open triangles; F = 6.533; p = .022; rm‐ANOVA). SBP did not differ between PD patients and healthy controls (ns)
