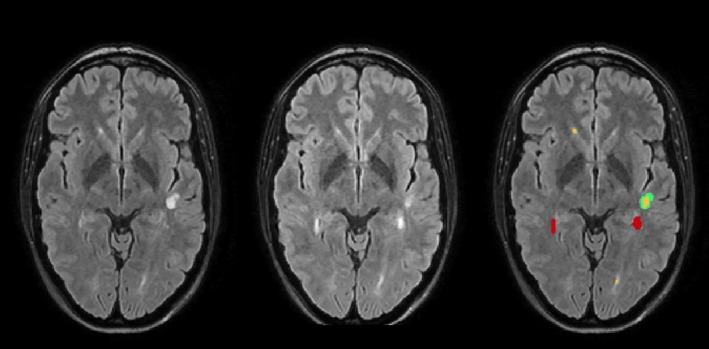
Figure 2.

An example of LST's comparison of two time points is shown for one patient. Axial slices of FLAIR images superimposed with white matter lesion maps are shown: left, time point 1; middle, time point 2; right, white matter lesion changes with the following color coding: red, increased; yellow, unchanged; green, disappeared. ml, milliliter
