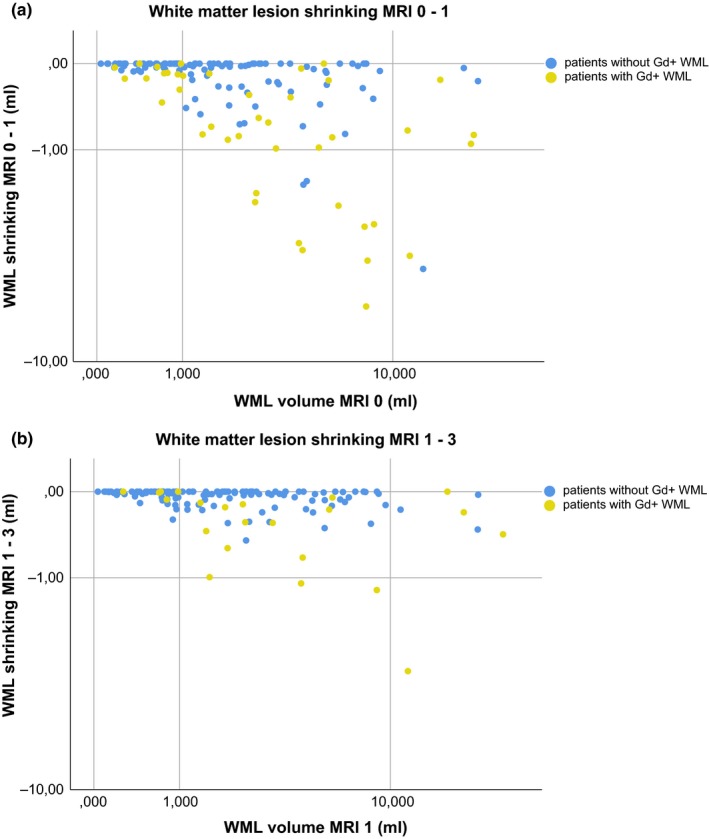
Figure 3.

Upper panel: The relation of white matter lesion volume at MRI 0 with white matter lesion shrinking between MRI 0 and 1 is illustrated by a scatter plot. Patients showing gadolinium‐enhancing white matter lesions are illustrated by yellow dots, patients without gadolinium‐enhancing white matter lesions by blue dots. Lower panel: The same graph is shown for the relationship between white matter lesion volume at MRI 1 with decrease in white matter lesion volume between MRI 1 and 3. Scaling of axes, logarithmic; ml, milliliter; WML, white matter lesion
