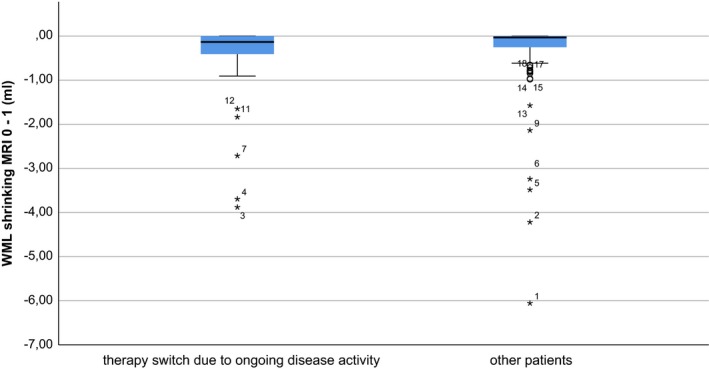
Figure 4.

Box plot of WML shrinking between MRI 0 and 1 for patients with therapy switch between MRI 1 and 3 due to ongoing radiological or clinical disease activity (left) and other patients (right; no therapy switch or switch within baseline therapies due to side effects) is shown. Patients are numbered with respect to the extent of white matter lesion shrinking (1 = highest). High WML shrinking between MRI 0 and 1 had no significant effect on therapeutic success (binary logistic regression model, p .948). Five patients with pronounced WML shrinking between MRI 0 and 1 were switched between MRI 1 and 3 due to ongoing clinical or radiological disease activity. Patients under escalation therapies at MRI 1 (N = 3) are not included
