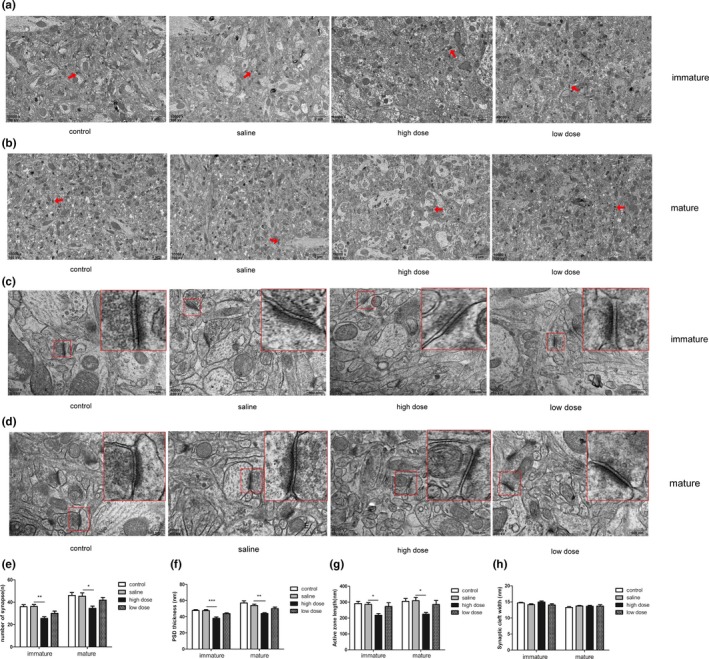
Figure 5.

Effects of exposure to low and high doses (2 and 10 mg/kg) of PM2.5 on synaptic ultrastructure in the hippocampal CA1 region in immature and mature rats observed using transmission electron microscopy. (a–b) Representative images (×10,000) showing the difference in the number of synapses in the four groups in immature and mature rats. (Red arrows indicate a synapse), scale bars = 2 μm; (c–d) representative images (×40,000) showing the differences in micro‐ultrastructure of synapses in the four groups in immature and mature rats. (the areas enclosed by the red box were amplified to delineate the synapses clearly), scale bars = 500 nm; (e–h) data analysis of synapse number, PSD thickness, AZ length, and cleft width. *p < .05 compared with saline group, **p < .01 compared with saline group, ***p < .001 compared with saline group
