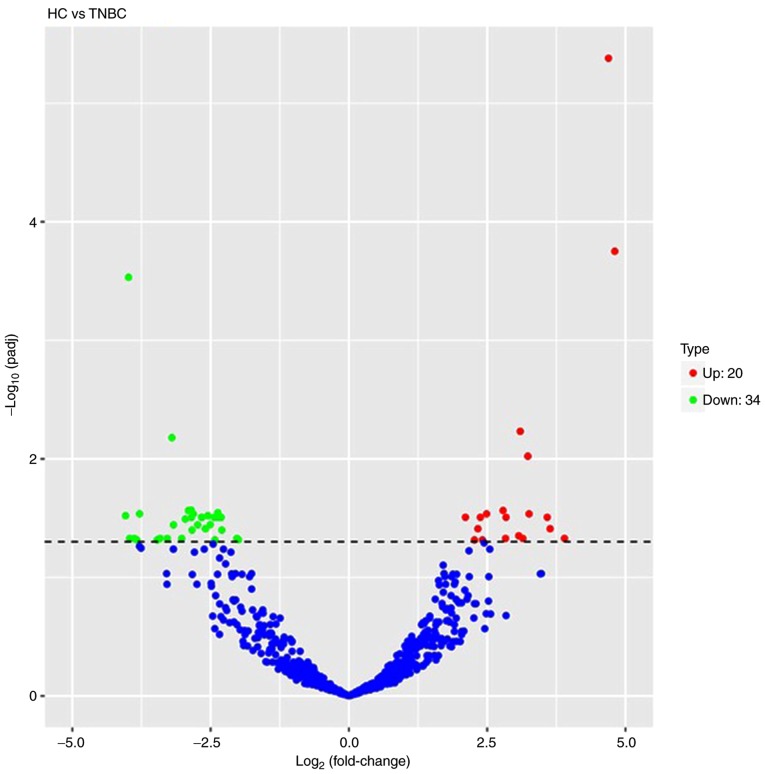
Figure 2.
Volcano plot of differential microRNA expression. x-axis, log2(fold change); y-axis, −1×log10(padj) for each probes. The scattered dots represent the individual microRNAs, the blue dots represent the microRNAs with no significant difference, the red dots represent the significantly upregulated differential microRNAs, and the green dots represent the significantly downregulated differential microRNAs. TNBC, triple-negative breast cancer; HC, healthy control.

