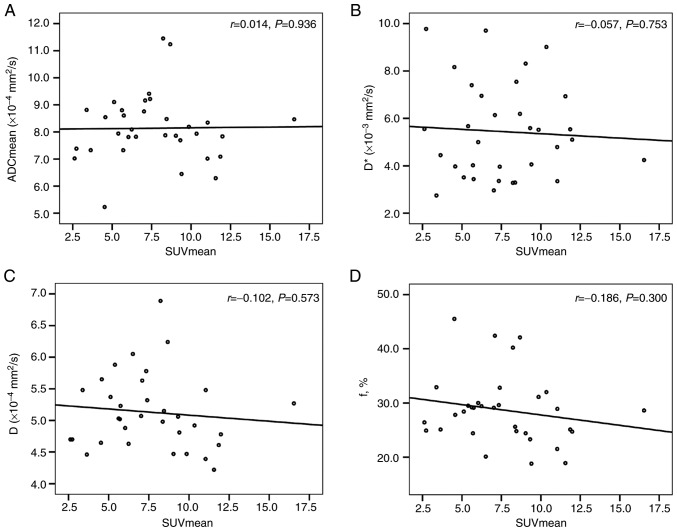
Figure 4.
Correlation analysis. Scatter plots of the correlation between (A) SUVmean and ADCmean, (B) SUVmean and D*, (C) SUVmean and D, and (D) SUVmean and f%. No statistically significant correlation was found between the SUVmean and ADCmean, D*, D and f values. SUV, standardized uptake values; ADC, apparent diffusion coefficient; D, true diffusion coefficient; D*, pseudo-diffusion coefficient.

