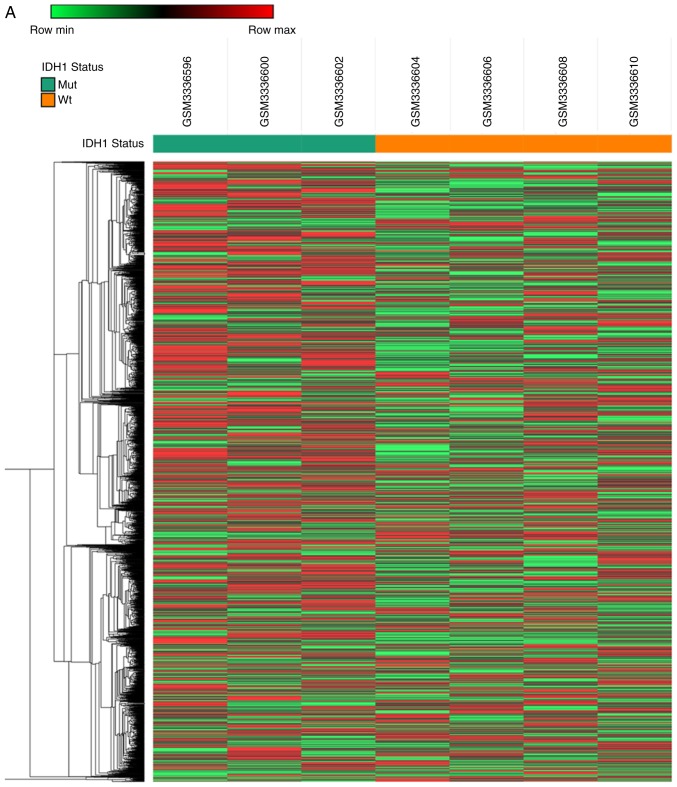
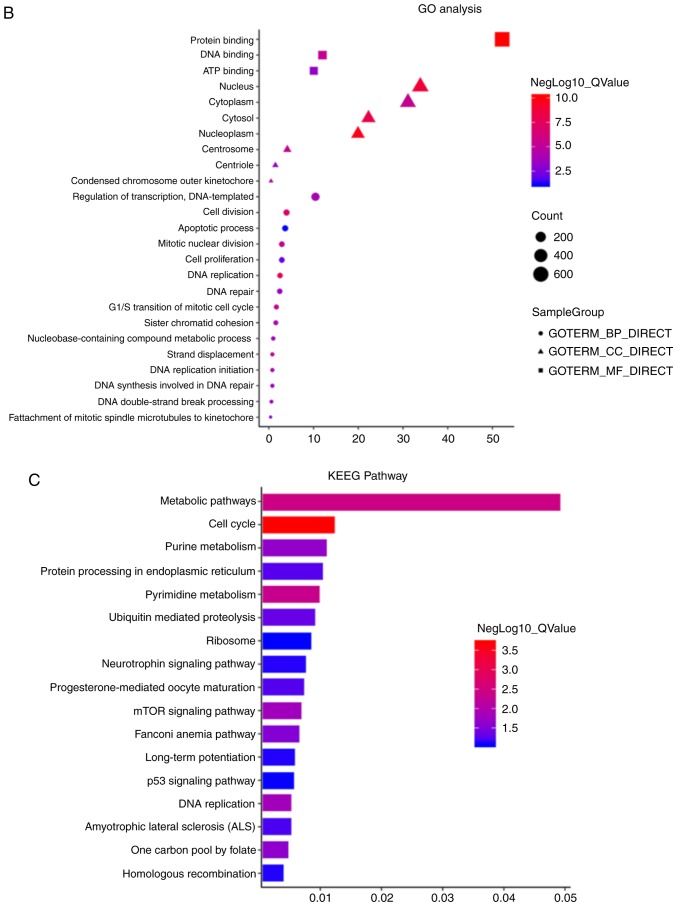
Figure 3.
Gene expression analysis of IDH1Wt and IDH1Mut glioma cells under hypoxia. A previously published database (GSE118683) reporting the profiling of glioma cells grown in hypoxic vs. normoxic conditions in vitro was used. (A) Heatmap of differentially expressed genes in IDH1Wt and IDH1Mut glioma cells in hypoxic conditions. (B) GO term classification of differentially expressed genes. Count represents the number of genes annotated by gene ontology database to each of the GO terms. (C) KEGG pathway analysis of differentially expressed genes. IDH1, IDH1, isocitrate dehydrogenase 1; Wt, wild-type; Mut, mutant; GO, gene ontology; KEGG; Kyoto Encyclopedia of Genes and Genomes; BP, biological process; MF, molecular function; CC, cellular component.


