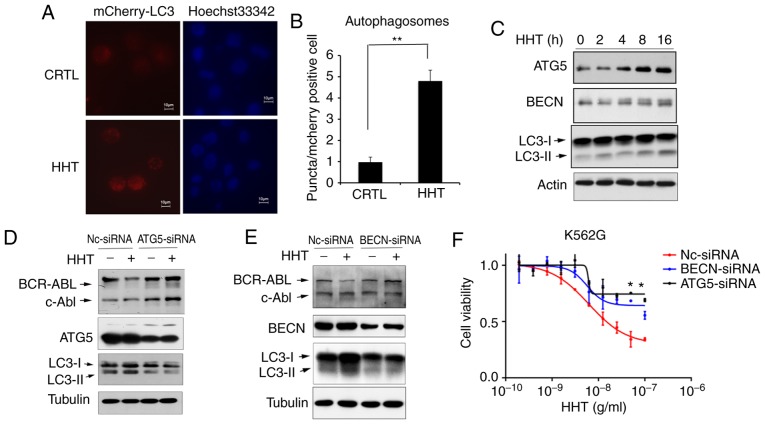
Figure 3.
HHT induces BCR-ABL degradation via the autophagy pathway. (A) Autophagosome levels in control and HHT-treated K562G cells. K562G cells were transfected with Ad-GFP-LC3B, and then treated with 50 ng/ml HHT for 8 h. Fluorescent images of mCherry-positive cells were analyzed by high-content screening. Representative images were captured on an Olympus fluorescence microscope at an ×40 magnification (Olympus IX71). (B) mCherry fluorescent puncta (autophagosomes, white arrowheads) were counted for 200 mCherry-positive cells per sample using Operetta High-Content Imaging System software (Harmony 4.6). The Kruskal-Wallis test revealed that the two groups had significant differences in the number of autophagosomes (**P=0.008). Bar graphs represent the mean values and error bars represent the standard deviations (**P<0.01 vs. the vehicle control). (C) The autophagy pathway was activated by HHT in K562G cells. K562G cells were treated with HHT (20 ng/ml) for indicated time-points, and then the cell lysates were analyzed for LC3, ATG5 and Beclin-1 by western blotting. (D) ATG5 knockdown prevented HHT-induced degradation of the BCR-ABL protein. ATG5 was stably knocked down in K562G cells (ATG5 siRNA) and control K562G cells (NC siRNA), and then the cells were treated with 20 ng/ml HHT for 24 h and subjected to immunoblotting. (E) Beclin-1 knockdown prevented HHT-induced degradation of BCR-ABL protein. Beclin-1 was stably knocked down in K562G cells (BECN siRNA) and control K562G cells (NC siRNA), and then the cells were treated with 20 ng/ml HHT for 24 h and subjected to immunoblotting. (F) Autophagy deficiency affected the cytotoxicity of HHT on K562G CML cells. Nc-siRNA, ATG5-siRNA and Beclin-1-siRNA K562G cells were treated with indicated concentrations of HHT for 48 h before assessing the viability by MTS assay. *P<0.05 compared to the cells transfected with NC siRNA. HHT, homoharringtonine; BECN, beclin-1.

