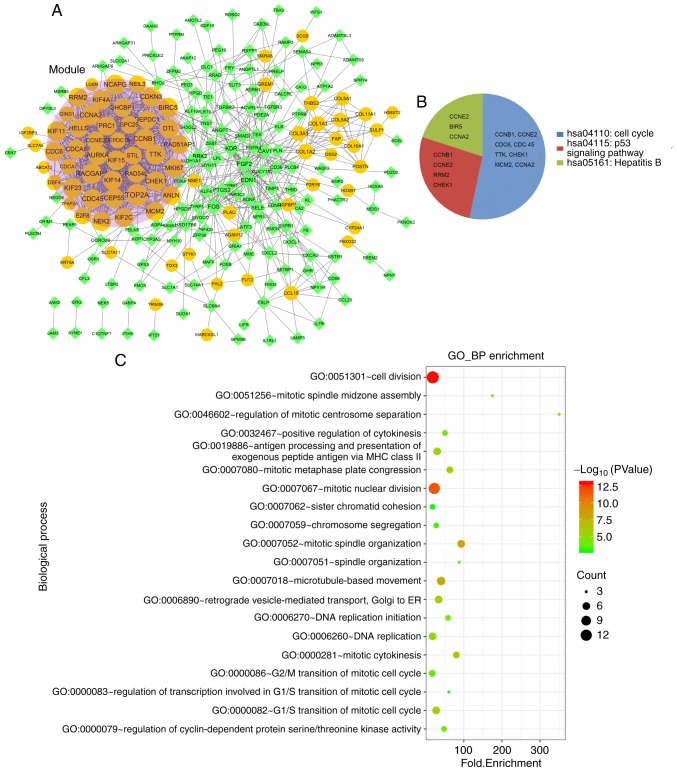
Figure 4.
(A) PPI and module network diagram. Yellow circles represent upregulated genes, and light green rhombuses represent downregulated genes. The shaded part is the module. Node size represents the degree: The higher the degree, the larger the node. (B) KEGG pathways enriched by module nodes. (C) GO functions enriched by module nodes. PPI, protein-protein interaction; GO, Gene Ontology; KEGG, Kyoto Encyclopedia of Genes and Genomes.

