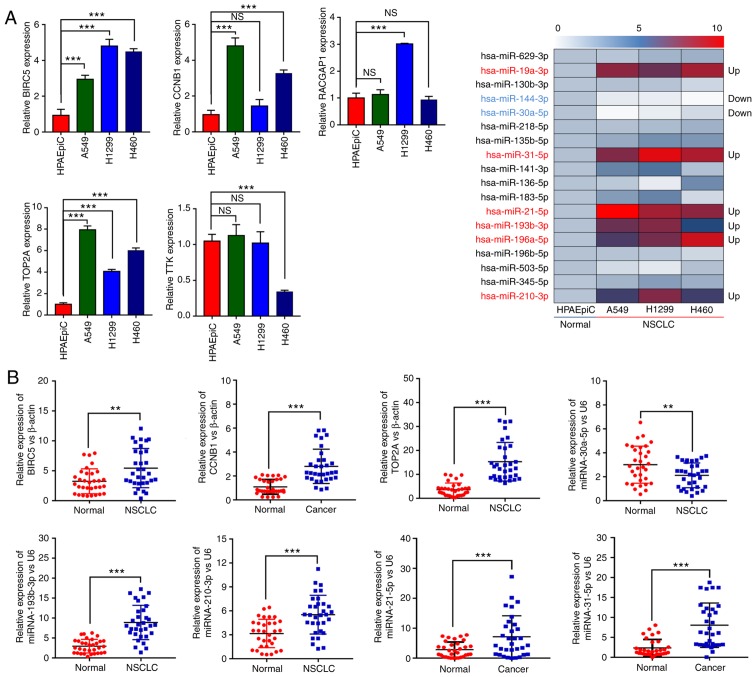
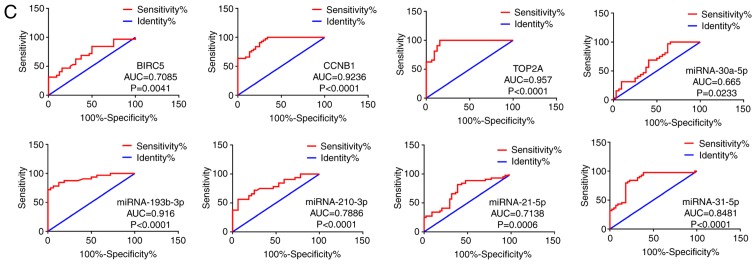
Figure 6.
(A) Relative expression levels of five DEGs and 18 DEMs in NSCLC and normal cells. (B) The relative expression levels of TOP2A, CCNB1, BIRC5, miR-30a-5p, miR-21-5p, miR-193b-3p, miR-31-5p and miR-210-3p in cancer and normal tissues. (C) The ROC curves of TOP2A, CCNB1, BIRC5, miR-30a-5p, miR-21-5p, miR-193b-3p, miR-31-5p and miR-210-3p. DEGs, differentially expressed genes; DEMs, differentially expressed miRNAs; NSCLC, non-small cell lung cancer; TPO2A, DNA topoisomerase II α; CCNB1, cyclin B1; RACGAP1, Rac GTPase activating protein 1; BIRC5, baculoviral IAP repeat containing 5; TTK, TTK protein kinase.


