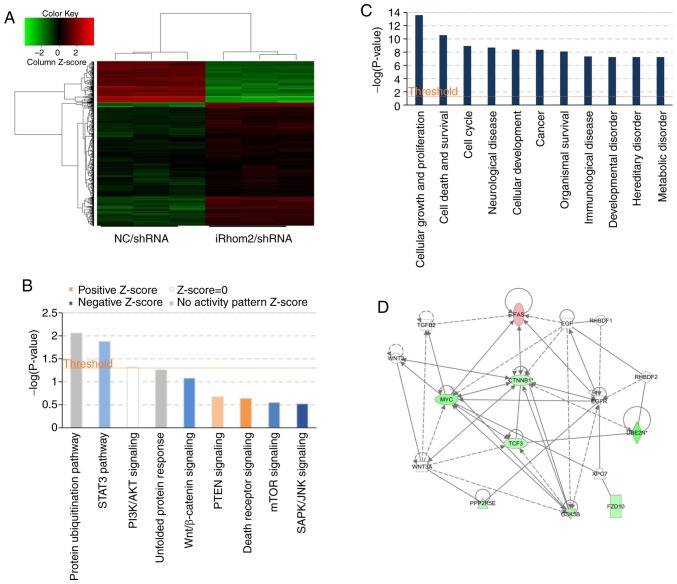
Figure 5.
Microarray and IPA analysis of HeLa cells following iRhom2 knockdown. (A) Heatmap of genes whose expression differed significantly when HeLa cells were transfected with iRhom2/shRNA vs. NC/shRNA. Genes are in rows and samples are in columns; red indicates upregulation and green indicates downregulation in cells expressing iRhom2/shRNA. (B) Enrichment of classical signaling pathways. Stimulated (orange) and inhibited (blue) canonical pathways (from the IPA database), are in descending order by the inverse of log(P). (C) Dysregulated cellular and molecular functions based on IPA analysis. The top ten disease types/functions are in descending order by the inverse of log(P). (D) Portion of the gene function network diagram, revealing major molecule-molecule interaction networks in known functional areas. Red indicates upregulation and green indicates downregulation, and brighter colors indicate stronger effects. Line indicates the interaction of two molecules, and full lines indicate stronger effects than imaginary lines. The arrows indicate the direction of action. IPA, Ingenuity Pathway Analysis; iRhom2, inactive rhomboid protein 2.

