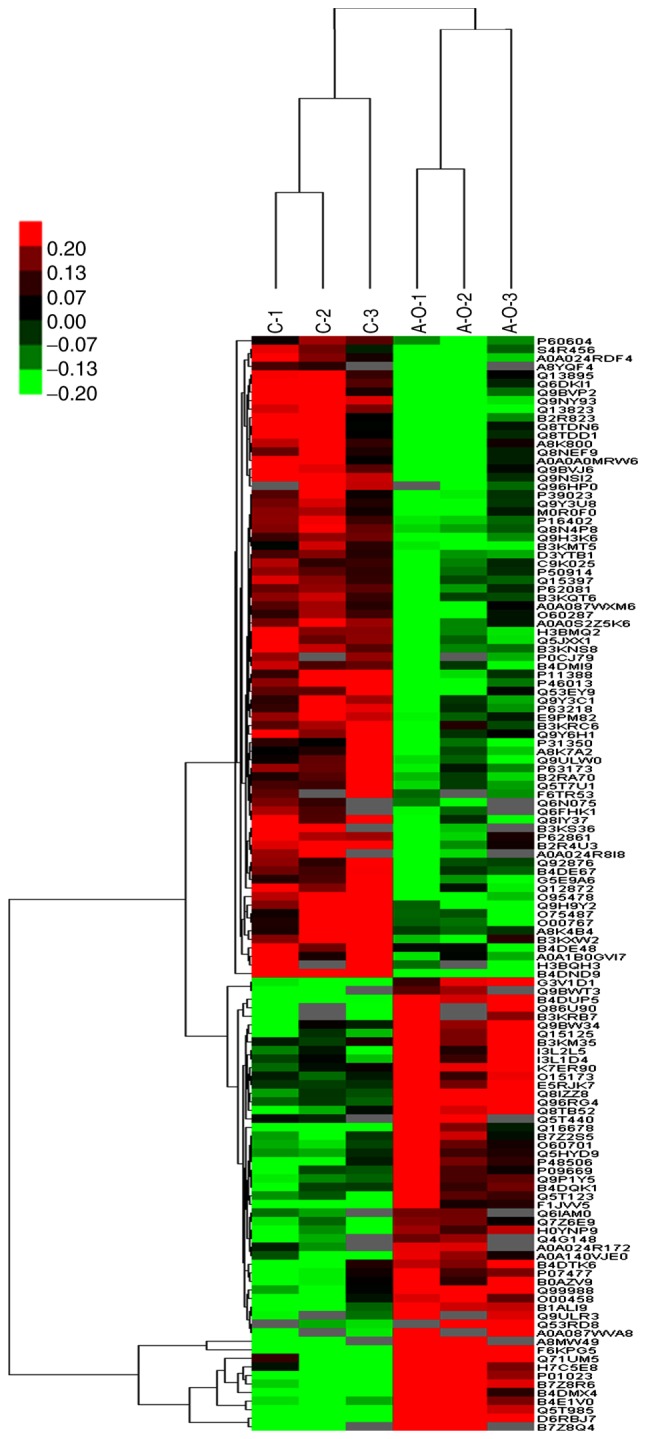
Figure 3.

Cluster analysis of differential level proteins between ACBP-OXA and the control. The colors indicate the differential protein levels, which increase successively from green to dark red. Increased levels of proteins are indicated in red, and decreased levels are marked in green. ACBP, anticancer bioactive peptides; OXA, oxaliplatin.
