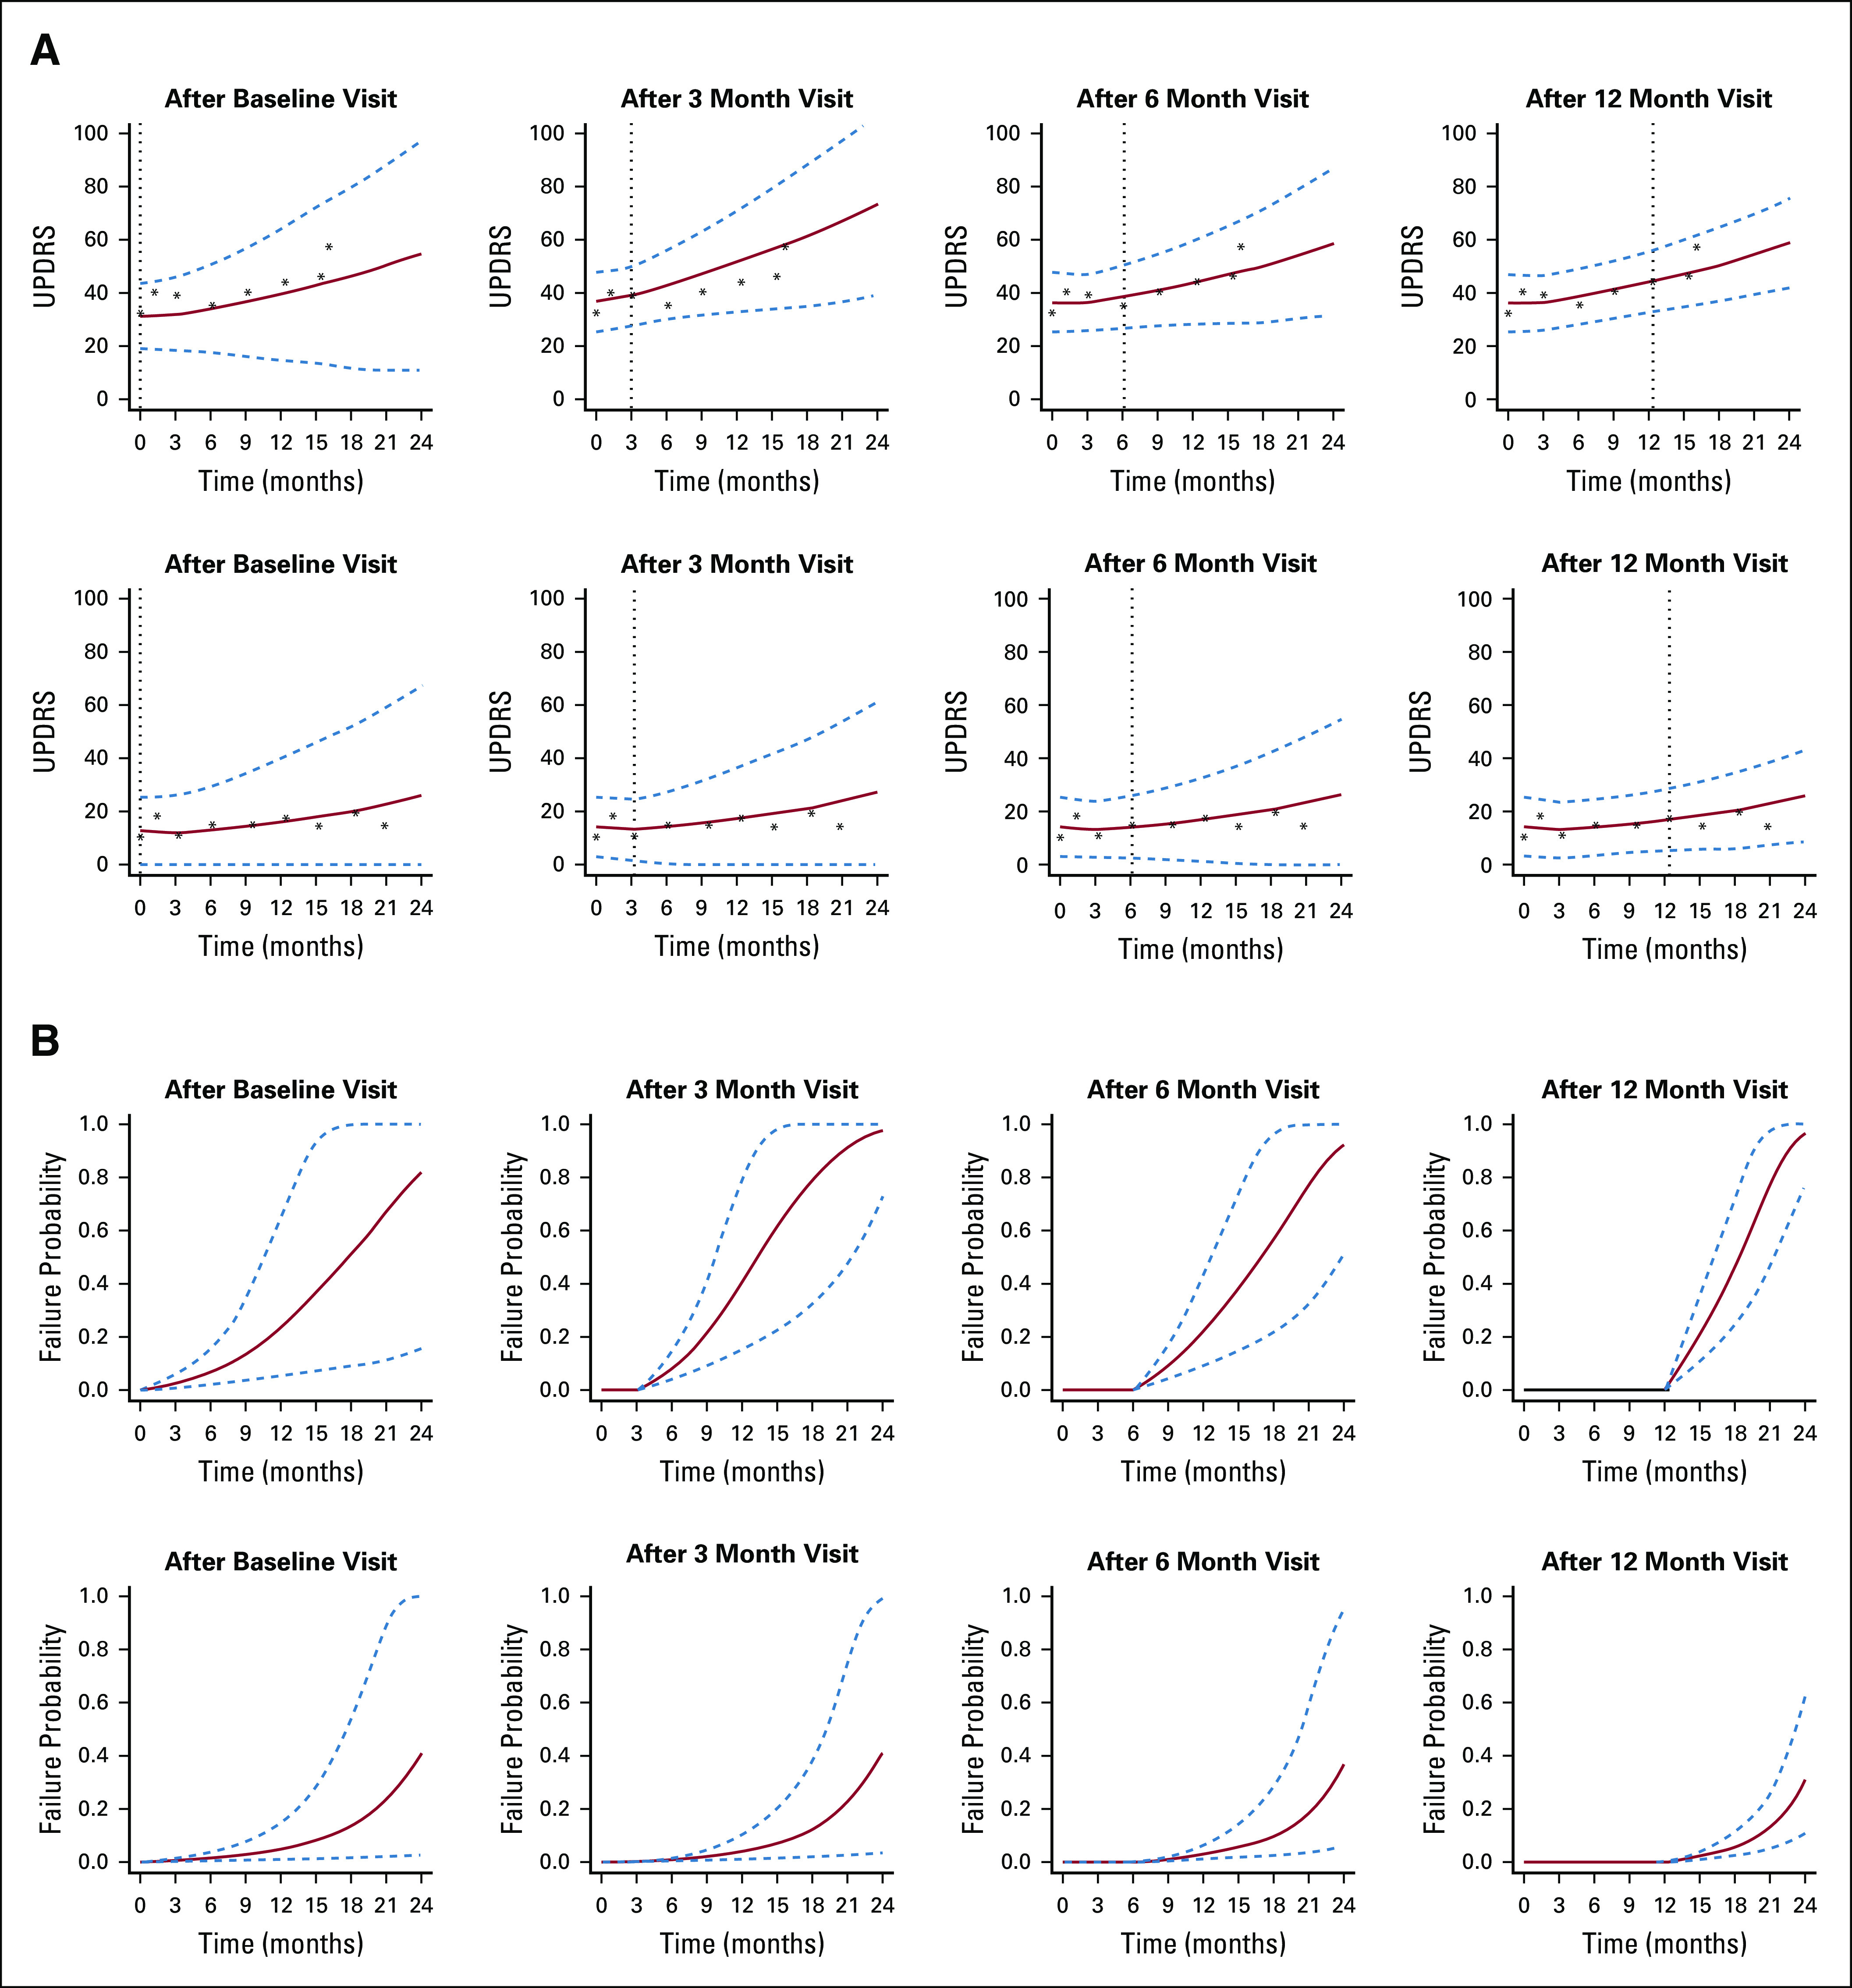
FIG 3.

(A) Predicted Unified Parkinson Disease Rating Scale (UPDRS) trajectories and (B) predicted conditional failure probabilities for patient 169 (top rows) and patient 718 (bottom rows). Solid lines are the means of 2,000 Markov chain Monte Carlo samples. Dashed lines are the 2.5 and 97.5 percentiles of the 2,000 Markov chain Monte Carlo samples. The vertical lines represent the landmark time. Reproduced with permission.87
