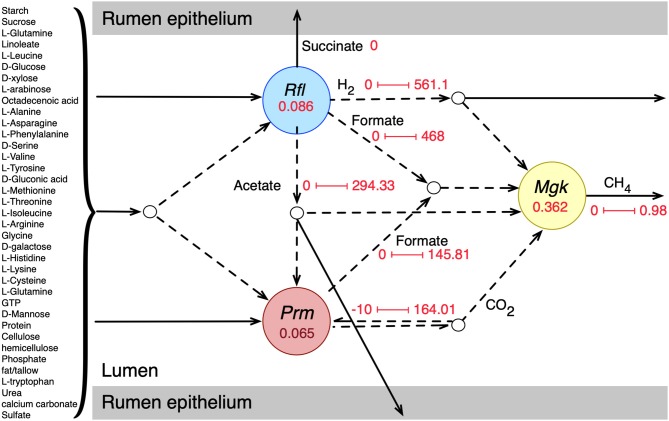
Figure 1.
Initial community simulation results showing the interactions between the bacterial and archaeal members. Rfl, Prm, and Mgk represent R. flavefaciens, P. ruminicola, and M. gottschalkii, respectively. The numbers inside the circles for each microbe represent the biomass flux (growth rate) of the respective microbe (hr−1). The arrows represent metabolic fluxes in mmol/gDCW.hr (dashes for inter-species/shared metabolites and solids for transfer to and from the rumen epithelium). The numbers along the arrows represent the minimum and maximum flux values.

