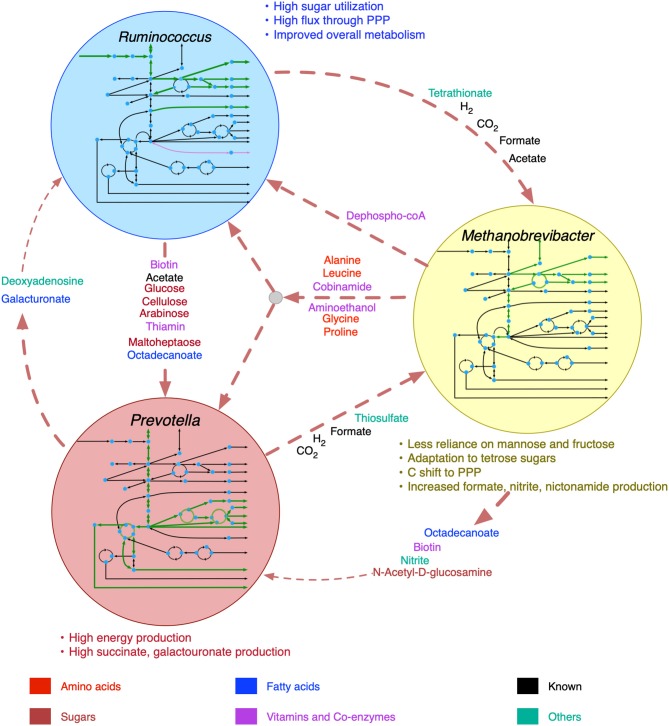
Figure 5.
Shifts in metabolism and inter-species interactions after the inclusion of viral auxiliary metabolic genes. Inside the circles for each organism, increase in pathway fluxes are shown in thicker green lines and decrease in pathway fluxes are shown in purple lines. Decreased metabolic transactions are shown in thinner dashed lines.

