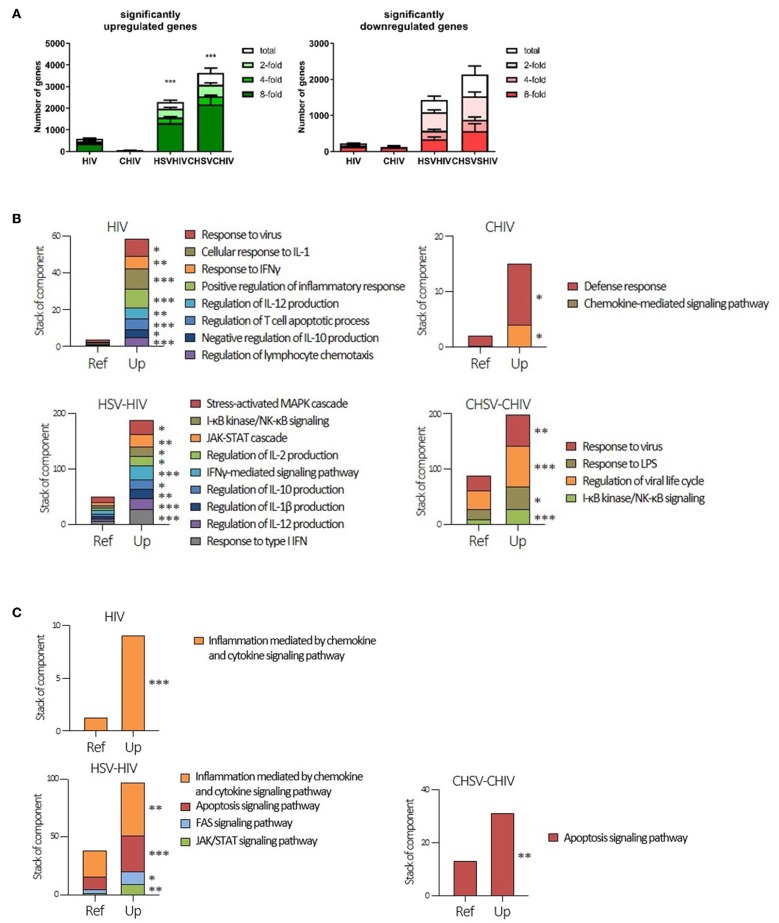
Figure 2.
Cellular programing of dendritic cells by HIV single and HIV/HSV dual infection. Dendritic cells were exposed to HSV-2 (HSV) or complement opsonized virus (CHSV) for 2 h then infected with HIV or complement opsonized HIV (CHIV) for 24 h. Whole transcriptome sequencing was performed. (A) Analyzes of amount of significantly upregulated or down regulated genes assessing total, two-, four-, and eight-fold changes compared to mock (B) Gene enrichment analysis of genes significantly upregulated three-fold or higher with p ≥ 0.05 with focus on inflammatory and antiviral pathways/factors. (C) Gene enrichment analysis of genes significantly upregulated three-fold or higher with p ≥ 0.05. GO enrichment analysis was done with PANTHER pathways data set. Terms with statistical significance in any of gene list are shown as stacked bar graph. *p < 0.05, **p < 0.005, ***p < 0.0005. Y-axis = number of listed genes involving in indicated PANTHER pathway. Ref = expected gene number from reference (whole human genes in database). N = 5.

