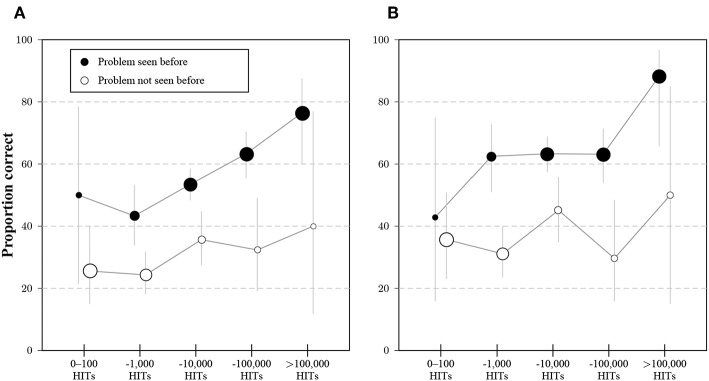
Figure 8.
Average proportion of correct answers to item 1 (A) and item 2 (B) for participants in Study 3 that indicated exposure (black dots) or no exposure (white dots) to the bat-and-ball problem, separated by the category of number of previous HITs on MTurk. Dot sizes correspond to the proportions of participants with and without experience for a given category of HITs. Whiskers indicate 95% CI for the proportions.

