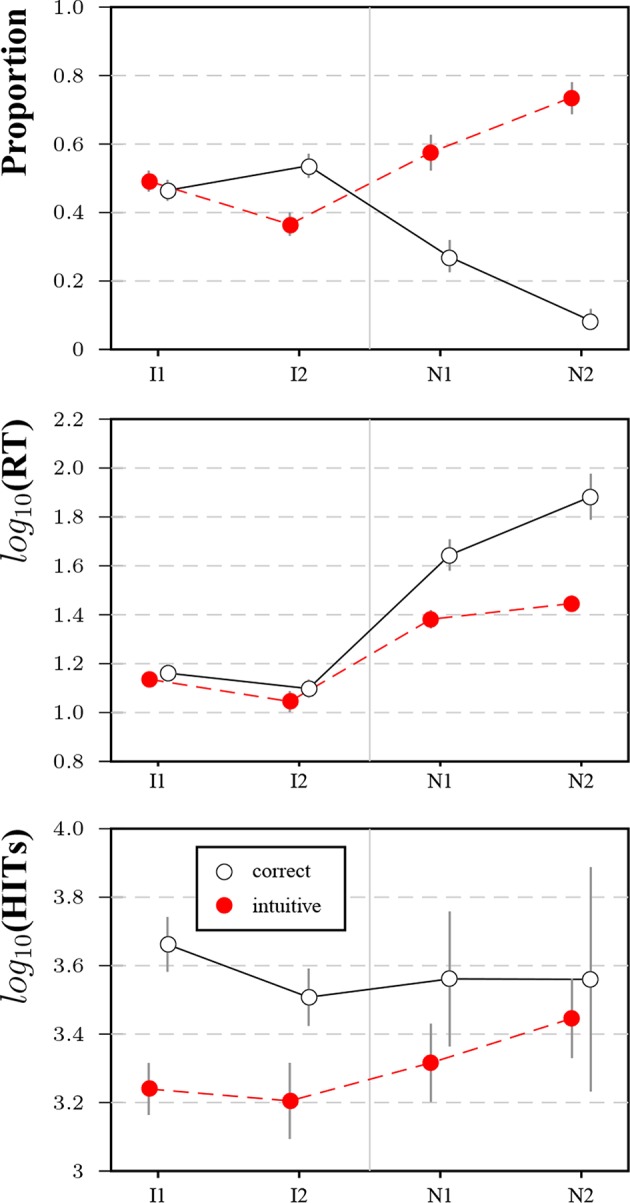
Figure 9.

Results for item 1 (I1), item 2 (I2) and the two novel items (N1 and N2) in Study 3. Subfigures show the proportion of intuitive and correct responses (top row), average logarithmized response times for response types (second row), and average logarithmized number of HITs (bottom row). Bars represent 95%-CIs for proportions and means, respectively.
