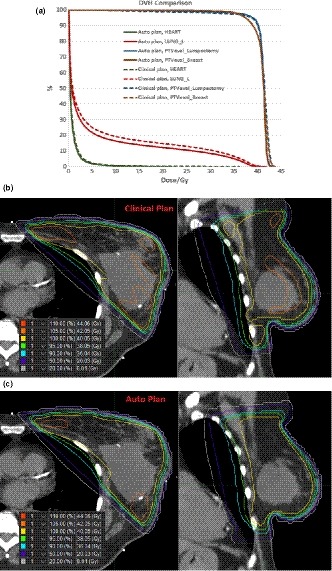
Figure 3.

Dose volume histogram (DVH) and isodose comparisons between the auto plan and the clinical plan for case #1. Top figure: DVH comparison; middle figure: isodose distribution of the clinical plan; bottom figure: isodose distribution of the auto plan.
