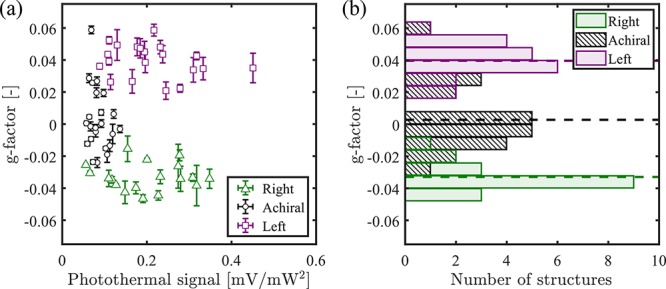
Figure 5.

Chirality-sensitive signal analysis. (a) Dissymmetry factor g vs photothermal signal for the 81 nanostructures, separated by groups according to the handedness. The insets show the corresponding handedness for each group. We observe that the data for each group are clustered together and present some dispersion, presumably due to fabrication imperfections. (b) Histograms of g for the three types of structures. We can clearly see different distributions, showing our ability to distinguish chiral and nonchiral structures. The mean g factor for each group of nanostructures is shown in the figure as dashed horizontal lines. We assign the width of these distributions mainly to fabrication imperfections.
