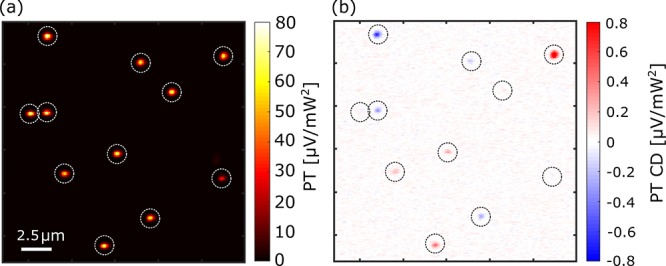
Figure 6.

Circular dichroism of individual nanospheres. (a) Photothermal image showing several gold nanoparticles, diameter 100 nm, on glass. Note the high uniformity of the spots in shape and intensity. (b) Photothermal circular dichroism image of the area shown in (a). Although most particles show low chirality signals, two particles have high negative (top left corner) or positive (top right corner) chiral signals. The g values for them are −0.83 and 1.82%, respectively. Dashed circles are guides for the eye.
