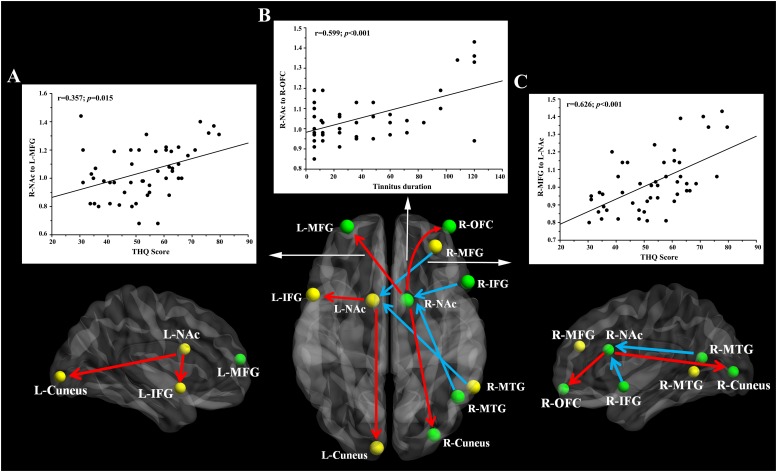
FIGURE 3.
The directional functional connectivity networks of the bilateral NAc. The red line represents the directional functional connectivity from the bilateral NAc to the other brain regions; the blue line represents the directional functional connectivity from the other brain regions to the bilateral NAc. (A) Positive correlation between the increased directional connectivity from the right NAc to left MFG and the THQ score (r = 0.357, p = 0.015). (B) Positive correlation between the increased directional connectivity from the right NAc to right OFC and the tinnitus duration (r = 0.599, p < 0.001). (C) Positive correlation between the enhanced directional connectivity from the right MFG to left NAc and the THQ score (r = 0.626, p < 0.001).

