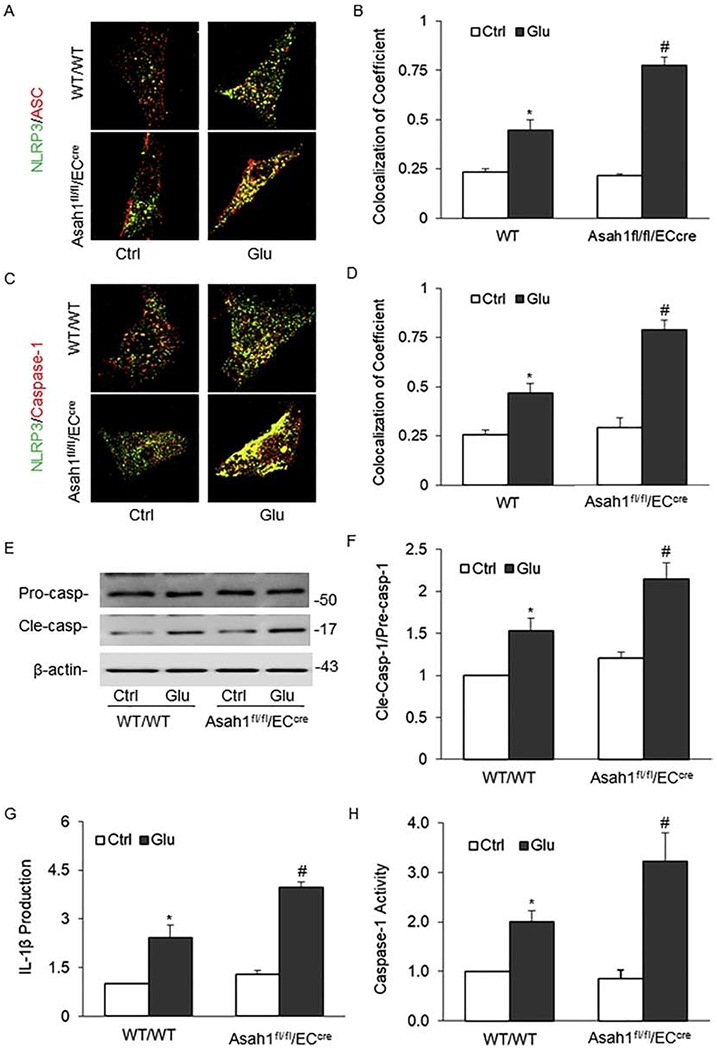
Fig. 5. Effects of AC on the activation and formation of NLRP3 Inflammasome in the primary cultures of coronary arterial endothelial cells (ECs) induced by high glucose.

A. Representative fluorescent confocal microscopic images showing the colocalization of NLRP3 with ASC. B. The summarized data showing the colocalization coefficient of NLRP3 vs. ASC. C. Representative fluorescent confocal microscopic images showing the colocalization of NLRP3 vs. Caspase-1. D. The summarized data showing the colocalization coefficient of NLRP3 vs. Caspase-1. E. Representative Western blot gel documents showing the expression of procaspase-1 and cleaved caspase-1 induced by high glucose. F. The summarized data showing the ratio of cleaved caspase-1 with procaspase-1 induced by high glucose. G. The summarized data showing caspase-1 activity (n=5). B. The summarized data showing IL-1β production. Glu: Glucose. Data are expressed as means ± SEM, n=5. * p<0.05 vs. WT/WT-Ctrl group; # p<0.05 vs. WT/WT-STZ.
