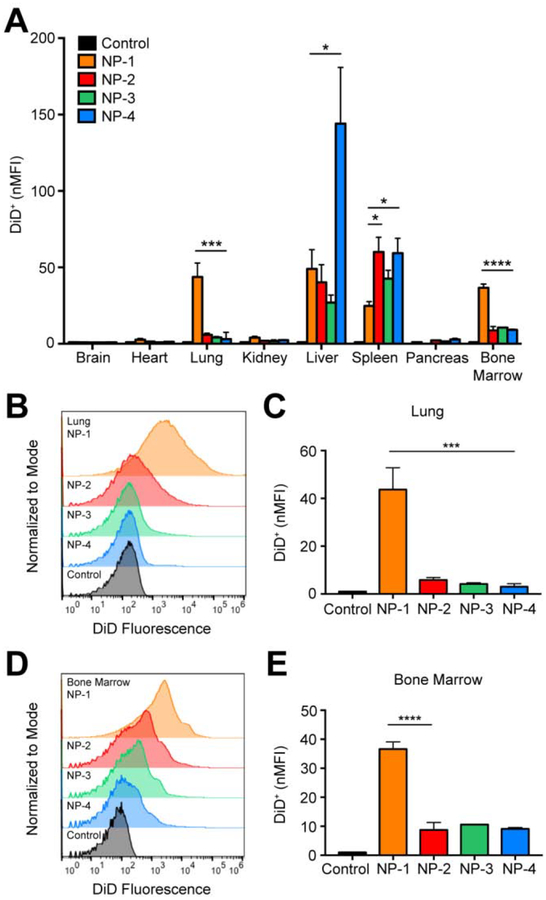
Figure 3. In vivo biodistribution of various sized PLGA NPs in bulk tissue.
(A) nMFI of DiD expression in all tissues quantified by flow cytometry. (B) Representative flow cytometry histograms showing DiD fluorescence in bulk lung tissue and (C) nMFI of DiD expression. (D) Representative flow cytometry histograms showing DiD fluorescence in bulk bone marrow and (E) nMFI of DiD expression. Data is shown as mean ± SEM (n = 3). Statistical significance was calculated using a one-way ANOVA test and significance is represented on graphs as *p ≤ 0.05, ***p ≤ 0.001, and ****p ≤ 0.0001. A more robust statistical analysis is shown in Table s3A.

