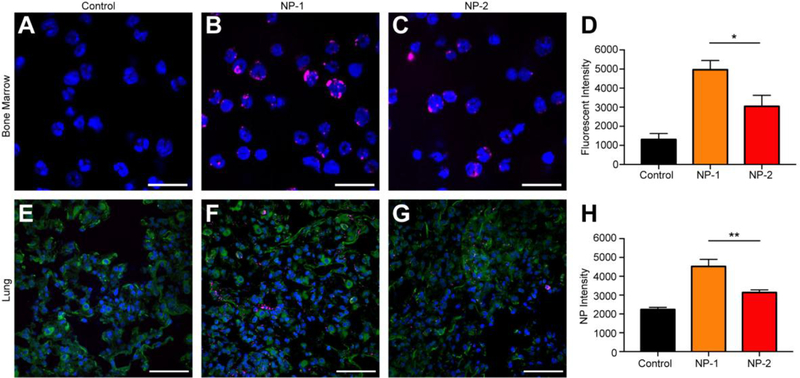
Figure 4. Confocal imaging of bulk bone marrow and lung tissue from animals administered with NP-1 and NP-2.
Representative images of bone marrow 24 h post-administration for (A) untreated control, (B) NP-1, and (C) NP-2, which are quantified in (D) as fluorescent intensity. Scale bars on images equal 10 μm. Representative images of lung tissue 24 h post-administration for (E) untreated control, (F) NP-1, and (G) NP-2, which are quantified in (H) as NP intensity. Scale bars on images equal 50 μm. Data is shown as mean ± SEM (n = 3). Statistical significance was calculated using an unpaired t-test and significance is represented on graphs as *p ≤ 0.05 and **p ≤ 0.01.

