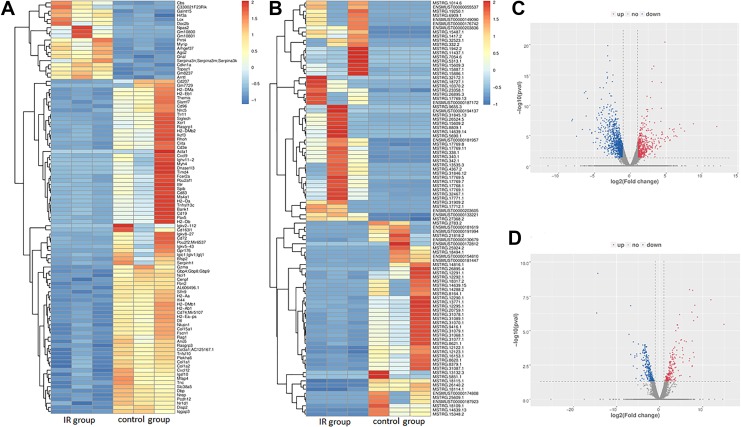
Figure 2.
The expression profiling in the radiation-induced lung injury group and control group. A total of 461 upregulated messenger RNAs (mRNAs) and 936 downregulated mRNAs are displayed in (A) the heat map and (C) the volcano plot; 401 upregulated long noncoding RNAs (lncRNAs) and 501 downregulated lncRNAs are displayed in (B) the heat map and (D) the volcano plot. Red represents upregulation and blue represents downregulation.

