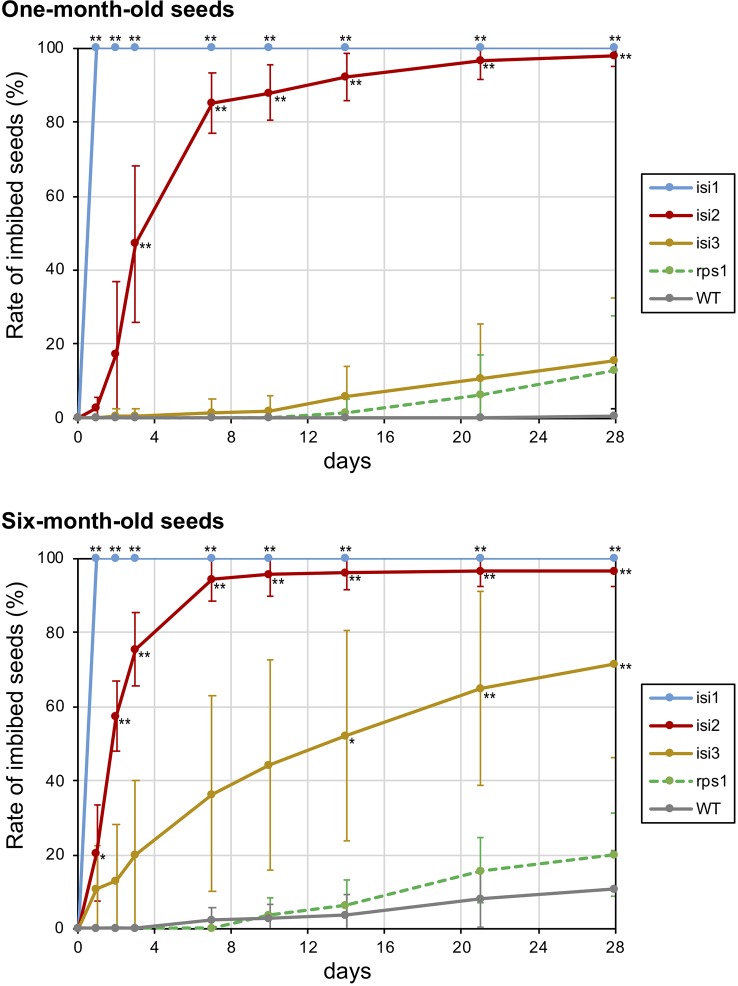
Figure 6.
Rate of imbibed seeds in the mutant plants over time. Twenty seeds of 1 and 6 months old were soaked in distilled water and number of imbibed seeds were manually counted twice a week for 4 weeks. The error bars indicate standard deviation of replicated evaluations (n = 7). Asterisks indicate that the mean values are significantly different from the wild type (** for p < 0.01 and * for p < 0.05).

