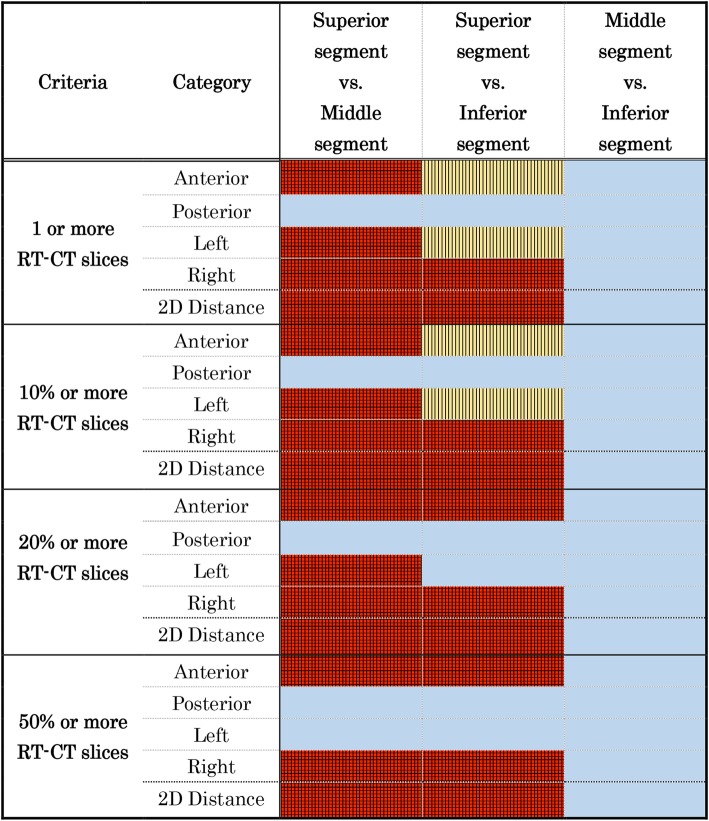
Fig. 7.
Results of the McNemar test of the number of patients who met the criteria Detail of the criteria is shown in the left column. The McNemar test was performed between each of the different segments of the prostate urethra. The significance level was set at p < 0.0167 (red plus lattice-patterned area), significant trends at 0.0167 ≦ p < 0.05 (yellow plus stripe-patterned area), and absence of significance at ≦0.05 (light blue area) by the Bonferroni method

