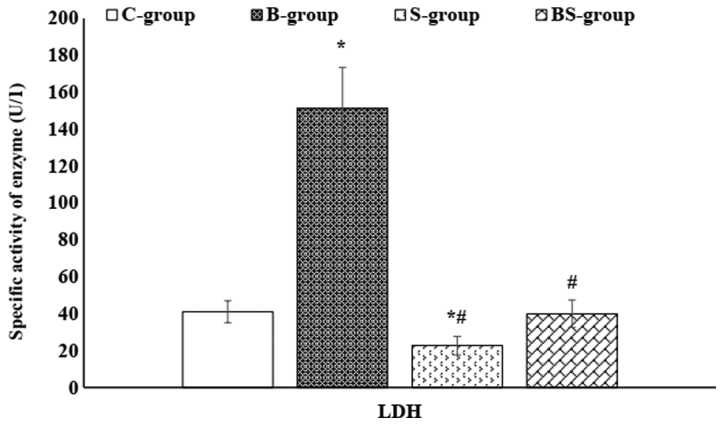
Figure 3.

Serum LDH enzyme activity in the different study groups. Data are presented as mean ± standard error. *P<0.05 vs. the control group; #P<0.05 vs. the BPA-treated group. C-group, control group; B-group, BPA-treated group; S-group, sesame lignans-treated group; BS-group, BPA plus sesame lignans-treated group; LDH, lactate dehydrogenase; BPA, bisphenol A.
