Fig. 6.
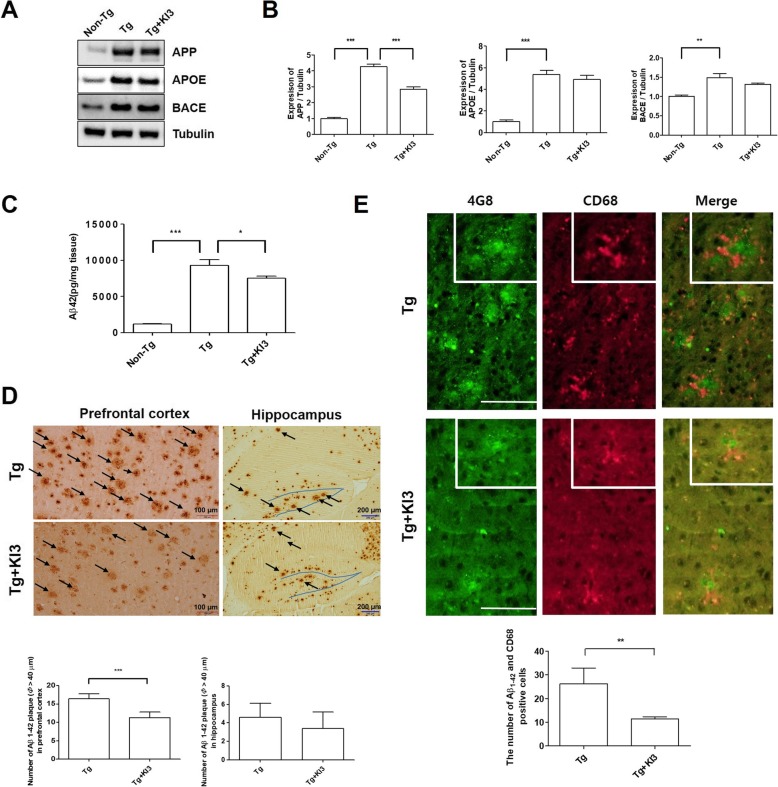
EA treatment modulates microglia-mediated Aβ deposition in 5XFAD mice. a Representative western blot images displaying the protein expression of APP, APOE, and BACE in the frontal cortex of mice from each group. Tubulin was used as the loading control. b Quantitative analysis of the immune blots normalized to tubulin (n = 3–4/group). c Insoluble Aβ1–42 levels in the murine prefrontal cortex, as determined by ELISAs (n = 4–5/group). d Representative images showing anti-Aβ (4G8) immunostaining in the prefrontal cortex and hippocampus region of 5XFAD mice. The black arrow indicates Aβ plaque with a diameter > 40 μm (d, upper). Quantification of Aβ plaques in the prefrontal cortex and hippocampus (n = 5/group; d, down). Scale bar, 100 μm and 200 μm. e Representative images of immunofluorescence staining using anti-Aβ (4G8) (green) and anti-CD68 (red) in the prefrontal cortex region of 5XFAD mice. The block of photomicrographs display typical CD68-positive cell in Aβ plaques (e). Quantitative analysis of the number of CD68+ cells/Aβ plaque (n = 5/group; e, down). Scale bar, 100 μm. Data are presented as means ± SEM (*p < 0.05, **p < 0.01, ***p < 0.001)

